Treatment Simulation Tutorial

This tutorial will guide you through a complete image-based treatment simulation.

The case involves a rather small, posterior, choroidal melanoma located adjacent to the macula in a left eye. This case was selected for the tutorial because it utilizes and benefits from many of Plaque Simulator's technologies. You will gain experience:

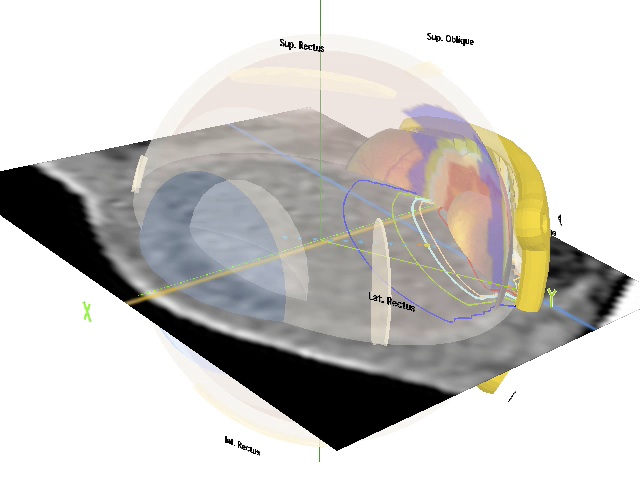
  • In the use of OsiriX to export multiplanar reconstructions (MPR) from 3D CT imaging to Plaque Simulator. Small ocular tumors are very difficult to image with CT or MR. In this case the tumor is visible in the CT images, albeit barely. The MPR images necessary for this tutorial are provided with Plaque Simulator.
  • Fusing fundus photography with CT.
  • Using ultrasound imaging.
  • Fitting a notched plaque to the nearby optic nerve.
  • Using a slot collimated plaque to spare the optic nerve.
  • Conforming the source loading pattern to match the shape of the tumor base.
  • Using the retina dose area histogram (RDAH) to evaluate dosimetric coverage of the tumor base and its surrounding margin.
  • Adjusting prescription height to assure margin coverage.
  • Calculating scleral suture coordinates.
  • Printing documents.
Movies/IntermediateTutorial

You may choose whether to use a JavaScript movie controller, including a Play/Pause button and a clickable timeline, or the original QuickTime movie controller:


These are steps that you will accomplish in this tutorial.

  1. Preparing for this tutorial
  2. Create a new patient
  3. Open the Images window
  4. Open the axial image
  5. Open the equatorial image
  6. Open the sagittal image
  7. Open the tumor-coronal image
  8. Open the tumor-meridian image
  9. Open the ultrasound image
  10. Open the fundus collage
  11. Calibrate the CT images
  12. Measure the eye size
  13. Calibrate the Fundus collage
  14. Digitize the tumor perimeter
  15. Enter the apex height
  16. Organize the windows
  17. Select a plaque
  18. Center the plaque under the tumor
  19. Enter implant and removal date and time
  20. Open the radionuclide inventory list
  21. Create a new radionuclide inventory entry
  22. Close the radionuclide inventory list
  23. Load sources into plaque
  24. Conform source loading pattern to the tumor base
  25. Prepare to calculate source strength
  26. Calculate source strength
  27. Prepare the isodose window
  28. Prepare the planar dosimetry window
  29. Calculate isodose distributions and the retina dose area histogram
  30. Review dosimetry
  31. Revise the prescription for better margin coverage
  32. Recalculate source strength
  33. Recalculate isodose and RDAH for the revised prescription
  34. Review revised dosimetry
  35. Calculate 3D dosimetry
  36. Review 3D model
  37. Print documents

Preparing for this tutorial

Plaque Simulator fuses images and measurements derived from CT (or MR), fundus camera photographs and ultrasound studies to build a three dimensional model of each patient's eye and tumor. A simulation session begins by preparing these images for import into Plaque Simulator.

After the images have been prepared, they will be imported into Plaque Simulator, typically as .jpg files, and calibrated. A 3D model of the eye will be created and the tumor location and altitude entered. Please review these links before proceeding with this tutorial.

Full size versions of the screen captures in this tutorial can be viewed by simply clicking on the pictures. Use the 'back' button of your browser to return to the tutorial after downloading the full size picture.


Create a new patient

From the File menu:

  • If you have been working on other plans since launching Plaque Simulator, select New Patient...to reset Plaque Simulator and create a new patient.
ITPatientIDs

From the Plan menu:

  • Select Patient IDs...to open the Patient ID window.
  • Name this planning session 'Intermediate'.
  • Optionally fill in any other patient or institutional identifiers.
  • Leave the file name blank.
  • ITPatientIDs
    ITPatientIDs

    Open the Images window
    • If the Image window is not visible, bring it to the front by selecting the Images item from the Window menu (in the menu bar at the top of the screen).
    • Increase the window size to fill a significant portion of your available screen by dragging the lower right corner of the window, or by opening the Window Size dialog and selecting one of the preset sizes or manually entering dimensions.
      ImageWindowSize
      WindowImages
    WindowImages
    ITStart

    Open the axial image

    In the Image window

    • Click the Axial button in the CT controls group.
    • A file navigation dialog will open.
    • The intermediate tutorial files can be found in the Tutorials folder which is located in the Plaque Simulator Patients folder which is in the Documents folder at the root level of your system hard drive. These files and folders should have been installed as part of your original installation or update of Plaque Simulator.
    • Open the image entitled Axial.jpg.
    ITOpenAxial
    ITAxialOpened

    Open the equatorial image

    In the Image window

    • Click the Equator button in the CT controls group.
    • A file navigation dialog will open.
    • Open the image entitled Equatorial.jpg.
    ITOpenEquatorial
    ITEquatorialOpened

    Open the sagittal image

    In the Image window

    • Click the Sagittal button in the CT controls group.
    • A file navigation dialog will open.
    • Open the image entitled Sagittal.jpg.
    ITOpenSagittal
    ITSagittalOpened

    Open the tumor-coronal image

    In the Image window

    • Click the Coronal button in the Tumor Apex controls group.
    • A file navigation dialog will open.
    • Open the image entitled T-Coronal.jpg.
    ITOpenTCor
    ITTCorOpened

    Open the tumor-meridian image

    In the Image window

    • Click the Meridian button in the Tumor Apex controls group.
    • A file navigation dialog will open.
    • Open the image entitled T-Meridian.jpg.
    ITOpenTMer
    ITTMerOpened

    Open the ultrasound image

    In the Image window

    • Click the Ultrasound button in the Tumor Apex controls group.
    • A file navigation dialog will open.
    • Open the image entitled US.jpg.
    • Note that the tumor height is 2.2 mm at the apex and 9.8 x 7.4 mm at the base.
    ITOpenUS
    ITUSOpened

    Open the fundus collage

    In the Image window

    • Click the Fundus button in the Fundus controls group.
    • A file navigation dialog will open.
    • Open the image entitled Fundus.jpg.
    ITOpenFundus
    ITFundusOpened

    Calibrate the CT images

    In the Image window

    • As detailed in this link, Calibrate the axial image first and then the other four CT reconstructions.
    • In the CT controls group, enable the CT Ruler, open the ruler diameter to 50 mm in the axial image, and click the Calibrate button.
    • Note: because all 5 multiplanar reconstructions were exported from OsiriX without changing magnification or window size, they all share the same calibration factor, so you only need to calibrate the axial image and copy the calibration to all the other CT reconstructions.
    ImageWndwCTGroupRuler
    ITCalibrateAllCTImages

    Measure the eye size

    In the Image window

    • Using the axial reconstruction, measure the size of the eye with the eye sizing tool as described in this link.
    • Then enable (by clicking the Eye button), position and orient eye sizing tools on the other CT reconstructions as illustrated.
    • The appearance of the eye sizing tools varies according to the tasks associated with each type of image. For example, only the axial eye tool includes the yellow colored portion of the tool that measures the angle between the posterior pole and the center of the optic disc.
    ImageWndwCTGroupRuler
    CalibrateCTEyeTool
    EquatorialTool

    Equatorial eye tool

    SagittalTool

    Sagittal eye tool

    CoronalTool

    Tumor-coronal eye tool

    MeridianTool

    Tumor-meridian eye tool


    Calibrate the Fundus collage

    In the Image window

    • Select the fundus image by clicking the Fundus button in the Fundus contols group.
    • As described in this link, Calibrate the fundus collage.
    • Be sure to set the number of photo centers (e.g 3 total in this example) from the popup menu. If there are more than 5 photos in the collage, choose those closest to the tumor.
    • Position photo centers #2 and #3 and adjust the photo diameter slider as illustrated.
    • Note: there is actually a portion of a 4th photo visible in this collage but because it is mostly obscurred by the other photos it can be ignored.
    ImageWndwFundusGroupRuler
    CalibrateFIFundusRuler

    Digitize the tumor perimeter

    In the Retinal Diagram window

    • If the Retinal Diagram window is not visible, bring it to the front by selecting the Retinal Diagram item from the Window menu (in the menu bar at the top of the screen).
    • As described in this link, digitize the tumor base perimeter.
    • In the status line just below the title bar of the Retinal Diagram window, observe that the maximum length and the radial length of the tumor base are both 9.9 mm which compares well with the 9.8 mm expected from the ultrasound measurements. The maximum width and the circumferential width are 7.0 mm which compares well with the 7.4 mm expected from the ultrasound measurements.
    WindowRetinalDiagram
    ITDigitizeTumor

    Before the fundus collage is warped.


    After tracing the tumor perimeter, using the original collage for best image quality, Plaque Simulator will circumferentially warp (aka auto correct) the tumor perimeter for mapping onto the polar diagram and will offer to warp (aka auto correct) the fundus image as well.

    ITCorrectedTumor

    After the fundus collage has been warped for correct mapping onto the polar retinal diagram.


    You can manually enable or disable fundus image warping using the Auto Correct Collage item in the contextual menu attached to the Photo button.

    RDPhotoBtnMenuX

    When checked, the Transparent Backgound item of this menu makes the black (or, optionally, another color of your choice) background of the original fundus collage transparent.


    Enter the apex height

    In the Retinal Diagram window

    • From the ultrasound measurements, the tumor shape is dome-like and the height at the apex is 2.2 mm.
    • In the Tumor controls group of the Retinal Diagram window:
      • Click the Dome button.
      • Click the Apex button and set the tumor height to 2.2 mm and the base margin to 2 mm.
    ITSetApexHeight
    ITSetApexHeight

    Organize the windows
    ITWindows

    Try to organize the windows of Plaque Simulator something akin to the illustration above. With the windows side-by-side, or slightly overlapped, you will be able to observe how changes made in one window affect the overall plan, and you will be able to quickly access the menus and functions of any window by simply clicking the cursor in that window to make it the frontmost (ie active) window. Note: recall that on MacOS the menubar at the top of the screen is contextual, its contents will change based upon which application or window of an application is currently the frontmost.


    Select a plaque

    In the Plaque Loading window

    From the Plaque menu select Plaque Files.

      PlaqueFiles

    From the Plaque Files menu select the EP917P file.

    PlaqueFilesEP917P
    ITEP917POpened

    The 'P' at the end of the file name EP917P indicates that this file includes an embedded picture of the face of the plaque.

    The EP917 plaque was selected because:

    • The semi ellipsoidal shape (ie this plaque is ellipsoidal near the eyelets, but notched on the opposite side) and size make a good physical and dosimetric fit to this tumor.
    • The wide notch allows the plaque to seat comfortably against the optic nerve.
    • The collimating slots for the radionuclide sources provide some sparing of the region within the notch.

    Center the plaque under the tumor

    In the Plaque controls group of the Retinal Diagram window:

    • You can drag and rotate a plaque on the diagram by setting the cursor controls to plaque mode. Click within the plaque perimeter to drag. The control and command keys rotate the plaque while dragging.
      RDCursorButtonsPlaque
    • Click the button labeled Center. The plaque will automatically center under the tumor with its suture eyelets balanced (equidistant from the limbus).
      RDCenterButton
    • Note the projection from the external sclera onto the retinal diagram showing the collision at the notched end of the plaque with the sheath surrounding the optic nerve.
    • Rotate the plaque counterclockwise for a better fit between the optic nerve and the notch.
      PlaqueRotateCCW
    ITEP917Centered

    Centered, eyelets balanced

    ITEP917CenteredAndRotated

    After rotating for proper fit at the notch


    Enter implant and removal date and time

    In the Prescription window

    • Using the date controls and/or the date window, set the implant insertion date and time and then the removal date and time.
    • In a subsequent step, you will calibrate your radionuclide sources to the same insertion date you choose here.
    • Implant durations between 4 and 7 days (96 to 168 hours) are typical.
    • The insertion and removal calendar buttons open the Calendar dialog where you can set date and time with an expanded user interface.

      ITRxCalendar
    • ITRxCalendar
    • In this tutorial, the implant is scheduled for insertion at 10 AM on October 17th, 2012 with a duration of 168 hours.
    • By default, Plaque Simulator sets the prescription (Rx) to 85 Gy at the apex of the tumor, accept that Rx for now.
    • The initial state of the 'Plaque 1 Central AXis table' is zero because there are no radionuclide sources in the plaque.
    ITRxSetDate
    • When the EP917P plaque file was opened, the initial states of the dose calculation mode buttons below the title bar of the window were automatically set to:
      • Linear, anisotropic source
      • No silicone seed carrier
      • Gold flourescence corrections enabled
      • No air scatter correction
      • No shell collimation (Note: shell collimation is redundant for Eye Physics slotted plaques such as the EP917 where virtually all collimation occurs at the slot edges adjacent to the seed rather than at the surface of the plaque face or shell. In this case, disabling shell collimation greatly accelerates the collimation ray tracing computation.)
      • Slotted collimation enabled
    • Do NOT change the calculation settings.

    Open the radionuclide inventory list

    In the Plaque Loading window


    In the Inventory List dialog:

    • Select Show only: and set the menu to the model of radionuclide source you intend to use (e.g. I-125 IAI-125A is a Plaque Simulator physics file for one of the IsoAid products, configured for specification of source strength as activity in mCi.
    • Click the Add button to open the inventory entry editor and create a new inventory entry for the selected model source.
    ITEP917POpened
    ITInventoryList

    Create a new radionuclide inventory entry

    In the Inventory Entry window

    • Name the entry 'tutorial'.
    • Set the number of sources to 17 of 17 (the model EP917 has slots for up to 17 sources).
    • Set the source strength range as 1.0 to 1.0 mCi.
    • Set the assay date to be the same as the implant insertion date you established a few steps earlier in this tutorial.
    InventoryEntryDate
    InventoryModifiedAlert

    Accept any changes to the inventory entry.


    Close the radionuclide inventory list

    In the Inventory List dialog

    • Click the list to select the just created entry.
    • Click the OK button to exit the dialog.

    ITInventoryDialog

    Load sources into plaque

    In the Plaque window, with the Retinal Diagram window visible alongside.

    • Click the Load button in the Plaque window.
      PlaqueLoadButton
    • All of the slots in the plaque will be filled with the currently selected inventory entry.
    • Click the Labels button.
      PlaqueLabelsButton
    • Enlarge the Plaque window if you wish for a better view.
    ITEP917PLoaded
    ITDiagramLoaded

    In the Retinal Diagram, the placeholders for loaded slots change to the color of the inventory entry.


    Conform source loading pattern to the tumor base

    In the Plaque window, with the Retinal Diagram window visible alongside.

    • Set the cursor mode to Load slot.
      PlaqueLoadSlotCursorButton
    • Note:
      • The other cursor modes are for designing new plaques.
      • In the Plaque window, the cursor changes its appearance to indicate when you are directly over a source placeholder and can load or unload it by clicking.
    • To create a source loading pattern that better conforms to the shape of the tumor base, remove the two sources that surround the notch by clicking on them in the Plaque window. The inventory count will be automatically updated.
    ITEP917PConformal
    ITDiagramConformal

    Prepare to calculate source strength

    In the Prescription (Rx) window

    • By default, Plaque Simulator sets the prescription (Rx) to 85 Gy at the apex of the tumor, accept that Rx for now.
    • The initial state of the 'Plaque 1 Central AXis table' is based upon the initial choice of 15 1.0 mCi sources in the plaque. The dose at the tumor apex (112.463) is greater than the initial Rx of 85 Gy.
    • Click the Implant Calculator button.
      RxCalculatorButton
    IT22RxWindowStart
    IT22PlaqueStart

    Calculate source strength

    In the Implant Calculator window

    • Click the Calc. Sources button. This will rescale the distribution of source strengths in the plaque (currently uniform) to deliver the prescription of 85 Gy to the tumor apex in 168 hours.
    • If an alert appears requesting to update the inventory to the new seed strength, respond Yes.
    RxAlert
    IT22ImplantCalculator
    IT22Plaque
    • The Prescription (Rx) window will update to reflect the new source strengths of 0.79 mCi per source.
    • Observe that the 'Plaque 1 Central AXis table' now lists the dose at the Rx point (tumor #1 apex at 2.2 mm) as 85 Gy.
    IT22RxWindow

    Prepare the isodose window

    In the Isodose window

    • Right-click on the Isodose button to display the contextual menu and select MyFavorite.idos. Note: by default, on MacOSX, simultaneously pressing the control button on the keyboard while clicking the cursor with a single button mouse is functionally the same as clicking the right button of a multiple button mouse.
    • The column of checkboxes simultaneously enables isodose lines on the retinal diagram, the meridian and coronal planar surfaces, and in the Patient Setup window.
    • The column of radio buttons selects a 3D isodose surface (e.g. 85 Gy) for 3D rendering in the Patient Setup window.

    IsodoseWndwFileMenuX
    IsodoseMyFavorite

    Prepare the planar dosimetry window

    In the Dosimetry window

    • Click the Dual pane side-by-side button. This will double the window width to display both the meridian and coronal planes.
      DosimetryDualPaneSideBySide
    • Click the T-Cor button. This will translate the coronal dosimetry plane from its default starting position at the equator to intersect the tumor apex and overlay the tumor-coronal CT image based on the location and orientation of the tumor-coronal eye sizing tool in the Image window.
      DosimetryTCorButton
    • Click the T-Mer button. This will rotate the meridian dosimetry plane to intersect the tumor apex and overlay the tumor-meridian CT image based on the location and orientation of the tumor-meridian eye sizing tool in the Image window. Note: by default, the dosimetry meridian plane passes through the center of the plaque, which, depending upon the plaque location, might not be directly under the tumor apex.
      DosimetryTMerButton


    CoronalTool

    Tumor-coronal eye tool

    MeridianTool

    Tumor-meridian eye tool

    IT22PreparePlanarDosimetry

    The final result will look like this.


    Calculate isodose distributions and the retina dose area histogram

    From the Dosimetry menu:

    • Select Calculate 2D matrices. This calculates dose to the meridian and coronal planar surfaces, and to the retina.
    • Select Calculate RDAH. This calculates the Retina Dose Area Histogram.
    IT22PlanarDosimetry
    IT22PlanarDosimetry

    Review dosimetry

    In the RDAH Document window

    • The retina dose area histogram (RDAH) shows that, while the tumor base (brown line on the histogram) is entirely covered by the 85 Gy isodose line, the tumor + 2 mm retinal margin surrounding the base (green line on the histogram) is only about 85% covered at 85 Gy. The 2 mm margin surrounding the tumor base is similar to the PTV concept, it accounts for microscopic tumor extension beneath the retina and uncertainty in surgical placement of the plaque.
    • We will need to revise the prescription in order to improve margin coverage.
    IT22RetinaDosimetry
    IT22RDAHDocument

    IT22PlanarDosimetry

    Revise the prescription for better margin coverage

    In the Prescription (Rx) window

    • From the prescription popup menu, change the prescription from the Tumor 1 Apex at 2.2 mm to the item labeled Tumor 1 TAX (inner + x.xx mm). TAX is an acronym for Tumor AXis.
    • In the Tumor Axis Prescription dialog set the TAX Rx height field to 4.5 mm from the inner surface of the sclera. Note: this will be approximately 5.5 mm from the plaque face.
    • Click the Implant Calculator button again, or, if the Implant Calculator window is still visible, simply click the cursor in that window to bring it to the front.
      RxCalculatorButton
    IT45ChangeRx
    IT45RxToTAX45

    Recalculate source strength

    In the Implant Calculator window

    • Click the Calc. Sources button again. This will once again rescale the distribution of source strengths in the plaque (currently uniform) to deliver the prescription of 85 Gy to the tumor apex in 168 hours at the new prescription point of 4.5 mm on the tumor axis.
    • If an alert appears requesting to update the inventory to the new seed strength, respond Yes.
    RxAlert
    IT45ImplantCalculator
    IT45Plaque
    • The Prescription (Rx) window will update to reflect the new source strengths of 1.35 mCi per source.
    • Observe that the 'Plaque 1 Central AXis table' now lists the dose at the Rx point (Tumor 1 TAX inner+4.50 mm) as 85 Gy.
    • The dashed blue line in the table shows that the Rx dose of 85 Gy falls between 5 and 6 mm from the surface of the plaque face as expected.
    IT45RxWindow

    Recalculate isodose and RDAH for the revised prescription

    From the Dosimetry menu:

    • Select Calculate 2D matrices. This calculates dose to the meridian and coronal planar surfaces, and to the retina.
    • Select Calculate RDAH. This calculates the Retina Dose Area Histogram.
    IT22PlanarDosimetry
    IT22PlanarDosimetry

    Review revised dosimetry

    In the RDAH Document window

    • The retina dose area histogram (RDAH) shows that the tumor base (brown line on the histogram) is again entirely covered by the 85 Gy isodose line. However, with the new prescription point at 4.5 mm on the tumor axis, coverage of the tumor + 2 mm retinal margin surrounding the base (green line on the histogram) has increased from 85% to about 99% at 85 Gy.
    IT45RetinaDosimetry
    IT45RDAHDocument

    Prescribing to a height greater than the tumor apex in order to assure base coverage is consistent with the COMS requirement to prescribe to 5 mm for tumors less than 5 mm tall. Note, however, that dose to the macula (orange line in the RDAH) increases noticably because the tumor borders the macula in this case, and dose to the remainder of the retina increases slightly as well. Fortunately, dose to the vitreous humour surrounding the tumor dome is not of biological concern, and dose to the lens is of minor concern because resulting cataracts can be treated with intraocular implants. The choice of prescription height in a case like this is a matter of clinical judgement.

    IT45PlanarDosimetry

    Calculate 3D dosimetry

    In the Dosimetry menu

    • Select Allocate 3D Matrix.
    • Select Calculate 3D Matrix.
    • The 3D matrix takes awhile to calculate. IT3DCalcProgress
    DosimetryAllocate3D
    DosimetryCalculate3D

    Review 3D model

    In the Patient Setup window

    • Click the 3D Dose button to render the selected 3D isodose surface.
      SetupControlsAppearance
    • Click the setup appearance button to open the appearance window window.
      SetupControlsAppearance
    • Experiment with the 3D model and the appearance controls to create pictures for the setup document.
    IT45Setup
    IT45SetupAppearance

    Print documents

    The Group button in the Documents window prints the group of documents selected by the Doc. group checkboxes to paper or to a .pdf file.

    IT45TreatmentPlanPage1

    The Treatment Plan is a 3 page document that summarizes the entire simulation. Page 1 provides a table of patient identifiers, date & time of treatment, some radionuclide, plaque and tumor properties, a facial picture of the plaque and a miniature retinal diagram showing tumor location.

    IT45TreatmentPlanPage2

    On page 2 there is a table of point dose calculations along the central axis of the plaque (or tumor), at the prescription point, lens, macula, etc..., a thumbnail of the fundus image, and an optional picture. The default picture is a radiation safety survey form.

    IT45TreatmentPlanPage3

    Page 3 contains thumbnails of the CT or MR images used to model the eye and any ultrasound images used to measure or model the tumor dome.

    IT45Loading

    The Loading Diagram document is a "road map" to the plaque. Everything the person or company (e.g. IsoAid) needs to manufacture the seeds and assemble the plaque is in this document.

    IT45Retina

    The Retinal Diagram document is a VERY useful "road map" to have in hand during surgery because it illustrates the tumor and plaque location, muscle insertion regions, lists the suture eyelet coordinates and the distance between the coordinates. Everything the surgeon needs to place the plaque at the planned position is in this document.

    IT45RDAH

    The Histogram document prints the Retina Dose Area Histogram (RDAH). The RDAH is a metric for comparing competetive treatment plan options.

    IT45SetupDocument

    The Setup document prints the contents of the 3D Patient Setup window.


    Guide Contents