The Retinal Diagram Window

DiagramWithIsodose

The retinal diagram is a 2D polar map of the retinal surface. The map is centered at the posterior pole. The radial spokes are meridian lines which originate at the posterior pole and extend to the limbus. The circles represent the equator, ora serrata, and the limbus. Digitized photographs of the retina can be applied to the diagram to help locate the tumor base.

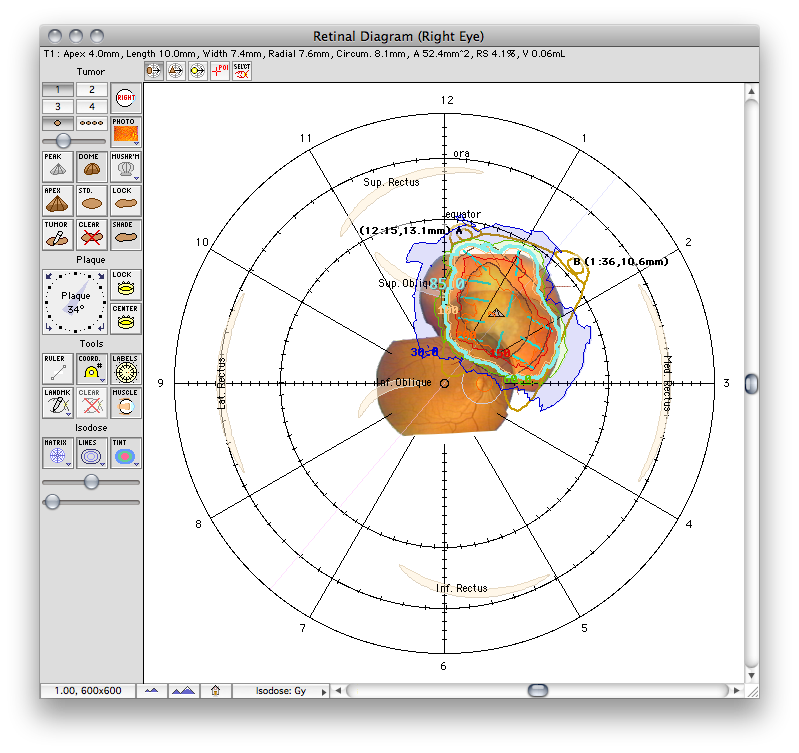
The Retinal Diagram window is where the shape of the tumor base and other anatomic landmarks of interest are digitized on a retinal diagram. This also where the height of the tumor is entered, the shape of the tumor dome is selected, muscle insertions are estimated, and suture coordinates on the scleral surface are calculated. The suture coordinates for each eyelet of a plaque are expressed as a meridian clock hour and a chord distance from the limbus circle. For example, the coordinates of the suture labeled B in the illustration to the left are B(1:36,10.6mm). This coordinate is therefore on the 1:36 o'clock meridian line, and 10.6 mm from the limbus using a Castroviejo caliper.


Cursor Control Group
DiagramControlsTumor
  • Drag Tumor - when enabled, click the cursor on the tumor to drag it on the diagram. The command and control keys rotate the tumor while dragging.
  • Drag Apex - when enabled, click the cursor on the tumor apex to drag it on the diagram.
  • Drag Plaque - when enabled, click the cursor on the projection of the plaque to drag it on the diagram. The command and control keys rotate the plaque while dragging.
  • Digitize POI - when enabled, the next cursor click on the diagram digitizes a point of interest.
  • Select Landmark - when enabled, click the cursor on a landmark to select it for subsequent action.

Tumor Group
DiagramControlsTumor
  • The buttons in this group are used to select the "active" tumor and control diagram appearance. Plaque simulator supports up to four tumor masses per plan, but normally only one is "active" at any time.
    • 1 - activates tumor #1.
    • 2 - activates tumor #2.
    • 3 - activates tumor #3.
    • 4 - activates tumor #4.
  • Right - toggles between left and right eye.
  • O - show only the active tumor.
  • OOOO - show multiple tumors.
  • Photo - map a fundus photo collage onto the diagram, the popup menu adjusts the appearance of the fundus collage.
  • Photo slider - eliminates the fundus photo backgound.
  • Peak - the tumor has a conical peak-like shape.
  • Dome - the tumor is domed shaped (default).
  • Mushroom - the tumor is mushroom shaped, the popup menu further refines the shape.
  • Apex - opens the Tumor Apex dialog to enter the tumor height, usually determined from ultrasound images, and set the PTV margin surrounding the base.
  • Std. - opens the Standard Tumor dialog to create a tumor with a circular or elliptical base.
  • Lock - lock the active tumor location.
  • Tumor - begin digitizing the base perimeter of the active tumor.
  • Clear - delete the active tumor perimeter.
  • Shade - tint the tumor perimeter.
DiagramPhotoBtnMenuAutoX

Buttons with small triangles in the lower right corner also have a popup menu which lists options for that button's function. Contol-clicking (note: the rightmost button on a multi-button mouse is usually equivalent to a "control-click" in MacOS) on these buttons displays the popup menu.


DiagramMushroomBtnMenuX
  • Auto Correct Collage - when enabled, the fundus collage is circumferentially warped to display correctly on the retinal diagram.
  • Transparent Background - makes fundus collage pixels of the selected color (e.g. black) transparent when drawing upon, or texturing 2D and 3D surfaces.
  • Transparent Color... - opens a dialog to select the background color of the fundus collage to be transparent, pure black by default.
  • Stem - the tumor has a generic mushroom-like shape with a stem.
  • Ball - the tumor has a generic ball or button-like shape.
  • Custom... - opens a dialog that permits more precise customization of the tumor shape.

Plaque Group
DiagramControlsPlaque
  • Plaque - rotate the active plaque.
  • Lock - lock the active plaque location.
  • Center - center the active plaque on the active tumor and balance the plaque eyelets.

Tools Group
DiagramControlsTools
  • Ruler - displays a distance measuring tool on the diagram. The ruler measures the chord or arc length between any two points on the diagram. The ruler is primarily used to measure tumor size and dosimetric margins around the tumor base. To use the ruler, simply drag the handle at each end to the desired position, or drag the distance indicator at the ruler center.
  • Coord. - displays scleral suture coordinates for the eyelets.
  • Labels - displays 1 mm tic marks and other labels on the diagram.
  • Landmark - enables landmark digitization.
  • Clear Landmark - delets the currently selected landmark.
  • Muscle - projects muscle insertions onto the diagram. Muscle labels can be disabled in the Diagram Options menu.
DiagramCoordBtnMenuX
DiagramLandmarkBtnMenuX

Isodose Group
DiagramControlsIsodose
  • Matrix - Enables isodose plotting, popup menu selects matrix size.
  • Lines - Enables isodose lines, popup menu changes labeling properties.
  • Tint - Enables isodose areal tinting, popup menu selects tint intensity.
  • Label Clustering Slider - Interactively adjusts the allowed proximity between isodose labels.
  • Label Spread Slider - Interactively adjusts the location of isodose labels.
DiagramMatrixBtnMenuX
DiagramLinesBtnMenuX
DiagramTintBtnMenuX

Footer Buttons
DiagramControlsZoom
  • Window size - Opens the Window Size Dialog dialog.
  • Zoom out - increases the plotted area. The dose matrix does not change.
  • Zoom in - decreases the plotted area. he dose matrix does not change
  • Home - resets pan and zoom to the default postions.
  • Isodose units - sets the isodose line display units for this window.


Diagram Menu | Image Window | Guide Contents