Dosimetry window

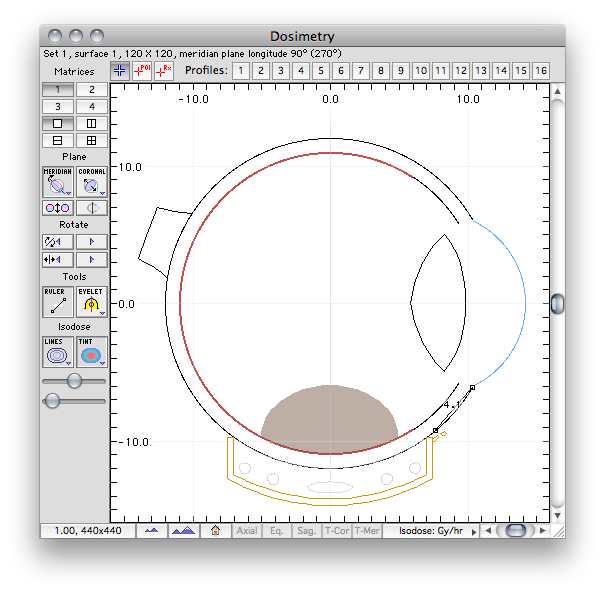
The 2D Dosimetry window displays isodose maps, plaque(s), points of interest, dose profile lines and anatomy on planar cross sections of the eye. The default display is a single pane illustrating a meridian plane bisecting the eye through the center of the active plaque. The meridian planne can be rotated about the AP axis of the eye. A coronal plane that, by default, bisects the eye at the equator may be also be displayed instead of, or in addition to the meridian plane. Controls to rotate the meridian and translate the coronal plane are provided. The planar cross sections may optionally be superimposed over calibrated CT or MR images.

The status line just below the window title bar lists the currently active dose matrix set, surface, matrix size and surface orientation or offset from the equator.

Points of interest (POI) and a user defined prescription (Rx) point may be digitized by enabling the appropriate cursor mode and clicking on the diagram. A ruler tool allows measurement between points. In the example on the left, a chord distance of 4.1 mm between the limbus and a suture eyelet projection onto the sclera is illustrated.

Additional control over 2D isodose plotting is provided in the Plot menu.

Cursor controls group

The buttons along the top of the window control cursor behavior and enable dose profile lines.

DoseCrosshairBtn

Crosshair mode

Sets the cursor mode to display information about the point clicked.

DosePOIBtn

Digitize POI

Sets the cursor mode for digitizing points of interest (POI).

DoseRxPointBtn

Digitize Rx point

Sets the cursor mode for digitizing Rx points.

DoseProfileBtn

Profiles

Enables the indexed dose profile line.


Matrices group
DosimetryControlsMatrices
  • Set 1 - Activates dosimetry set 1 and plaque 1.
  • Set 2 - Activates dosimetry set 2 and plaque 2.
  • Set 3 - Activates dosimetry set 3 and plaque 3.
  • Set 4 - Activates dosimetry set 4 and plaque 4.
  • Single pane - Displays only the currently active dosimetry set. To facilitate rapid dosimetric comparison of prospective plaque designs, Plaque Simulator supports 4 plaques and 4 dosimetry sets per patient. By default, each dosimetry set is associated with a corresponding plaque. Set 1 is associated with plaque 1, set 2 with plaque 2, and so on. Only one plaque (and its dosimetry set) at a time are normally considered to be "active". Changing either the active plaque or the active dosimetry set autmatically changes both the plaque and its associated dosimetry set. (This behavior can be disabled in case you wish to apply all four sets to the same plaque).
  • Dual pane - Displays side-by-side meridian and coronal dosimetry for the active dosimetry set.
  • Dual pane - Displays stacked meridian and coronal dosimetry for the active dosimetry set.
  • Quad pane - Displays meridian or coronal all four dosimetry sets.
DoseDualPane

Plane group
DosimetryContolsPlane
  • The Meridian button activates dosimetry surface #1 for calculation and display. By default the dose matrix for this surface is calculated on a plane which bisects the eye along a meridian. This plane is defined by points at the anterior pole, posterior pole and, if autotracking is enabled, the center of the plaque. Control click on this button to change the dose matrix size. Plaque Simulator defaults to a 120x120 matrix. Use the largest size your computer can calculate in a reasonable amount of time.
  • The Coronal button activates dosimetry surface #2 for calculation and display. Control click on this button to change the dose matrix size. By default this matrix is calculated on a coronal plane at the equator. The position of this plane is set by the plane positioning arrows in the Rotate group below and also in the Setup Window controls.
  • The Flip meridian button rotates the meridian plane 180 deg.
  • The Equator button resets the coronal plane to its home position at the equator of the eye.
DoseMeridianPopUpMenus

DoseCoronalPopUpMenus

Rotate group
DosimetryControlsRotate

Tools group
DosimetryControlsTools
  • Ruler - this button enables a measurement ruler. Option-clicking this button moves one end of the ruler to the intersection of the sclera and limbus. The other end of the ruler moves to the suture point on the sclera beneath the most recently selected Eyelet (e.g. 11.3 mm in the illustration above). You can manually drag the ruler to measure arbitrary chord distances if you wish.
  • Eyelet - this button sequentially moves the meridian plane to pass through each of the plaque's eyelets. If enabled, the Ruler will automatically adjust to show the chord distance between the limbus and the scleral suture point beneath the eyelet. Control-click (or right mouse button) on this button to popup a contextual menu from which you can select a specific eyelet.

Isodose group
DosimetryControlsIsodose
  • Lines - this button enables isodose lines.
  • Tint - this button tints the region between isodose lines. Control click on this button to change the tint level.
  • Label sliders - PS will spatially shift isodose labels to prevent overlap. These sliders adjust the initial location and minimum spacing threshold between isodose labels.

Footer Buttons
DosimetryControlsZoom
  • Window size - Opens the Window Size Dialog dialog.
  • Zoom out - increases the plotted area. The dose matrix array dimensions do not change, so the physical spacing between calculated points increases proportionally.
  • Zoom in - decreases the plotted area, and proportionally decreases the spacing between dose matrix calculation points.
  • Home - resets pan and zoom to the default postions.
  • Axial - sets the meridian plane to overlay the axial CT image.
  • Eq. - sets the coronal plane to overlay the equatorial CT image.
  • Sag. - sets the meridian plane to overlay the sagittal CT image.
  • T-Cor - sets the coronal plane to overlay the tumor-coronal CT image.
  • T-Mer - sets the meridian plane to overlay the tumor-meridian CT image.
  • Isodose units - sets the isodose line display units for this window.


Profile Lines | Plot Menu | Guide Contents