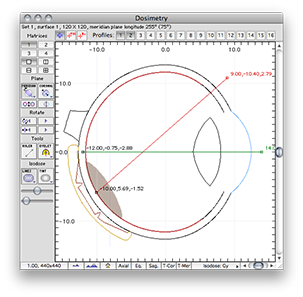
Dose profile lines are created in the planar Dosimetry Window. You can plot up to 16 profiles. To enable a profile, simply click its button and drag the endpoints of the line on the plot.
You can place the endpoints anywhere in 3D space by rotating or translating the planar dosimetry surfaces and creating new profiles or dragging the endpoints of existing profile lines. Profile lines are projected onto the planar surface but the endpoints only move in 3D space when you drag them.

In this example, profiles 1 and 2 have been enabled.
|
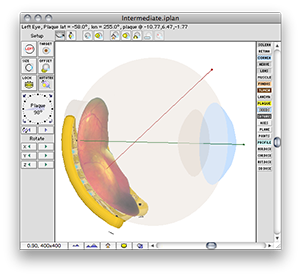
The profile lines can be displayed three dimensionally in the Patient Setup window by enabling the Profile button.

|
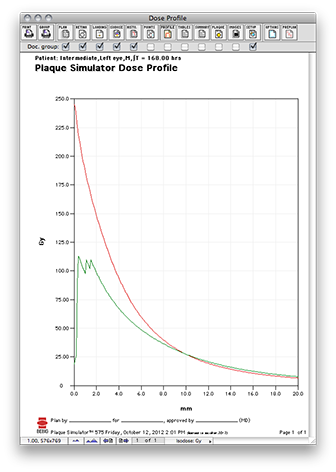
Dose profiles are plotted in the Profile Document.
|