- At this point in the calibration process you should have completed all of the tasks described in the Central Axis Measurements section.
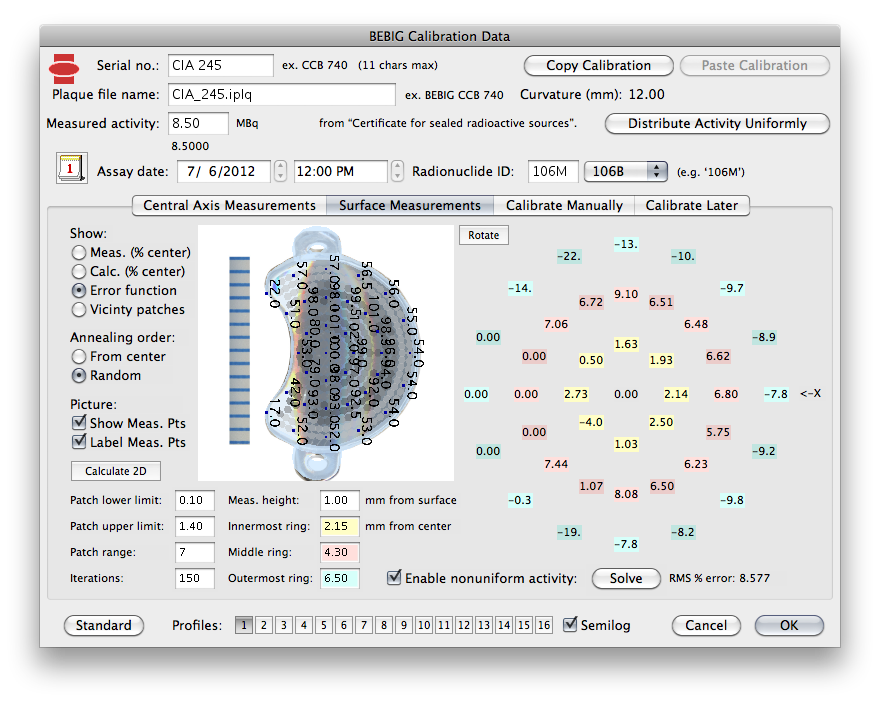
- In the BEBIG calibration dialog, click the Surface Measurements tab.
- In the Show group click the Meas. (% center) button.
- The picture of the plaque should match the protocol sheet orientation. If not, rotate the picture or sheet as necessary.
- Enter the meas. height of the BEBIG surface measurements, this is typically 1 mm from the surface of the plaque.
- Enter the central, and 3 rings of surface measurements from the protocol sheet into the simulated annealing control point fields as illustrated.
- Near-surface measurements that are not directly above the silver surface of the plaque can not be used for simulated annealing, so the outermost ring of the protocol sheet (values of 2, 5, 6 etc...) in this example will not be entered, nor will the measurement at 9 o'clock (6) situated directly over the notch.
- Fill in all remaining simulated annealing control points for which measurements are not provided, provided those points are over the plaque surface. Set all unused simulated annealing fields to zero (0.00).
- Enter the radius of the PS outermost ring as 8.3mm. From the protocol sheet the diameter of the 3rd ring (that corresponds to the PS outermost ring) is defined as 17.1 mm. Dividing this by 2 yields a radius of 8.55 mm. However, in the PS model of the plaque, that would place the point over the exact edge of the plaque where there are no underlying radionuclide patches, so subtract 0.25mm to make sure the ring sits above a radionuclide patch source in the PS model.
- Equally space the inner and middle ring radii between the center and outermost ring. In this case the radii were rounded to 2.75 and 5.5 mm respectively.
- The patch lower limit is the minimum fraction that a patch can decrease to, in this example no patch can be reduced to less than 0.10 (ie 10%) of its original (uniform distribution) strength.
- The patch upper limit is the maximum fraction that a patch can increase to, in this example no patch can exceed twice (2.0) its original strength.
- Start with a patch range of 7. The radionuclide patches are modeled as hexagons. The value of 7 is the number of patches that include a hexagon and its adjoining hexagons. The surface annealing algorithm will redistribute source strength equally to the 7 closest patches to a measurement point until the upper or lower limits are reached. After the 7 closest patches have reached their strength limits, nighboring patches will be included sorted by distance from the measurement point.
- Start with 150 iterations of the surface annealing process in random order.
- Check the Enable nonuniform activity checkbox and then click the Solve button to begin the redistribution of radionuclide strength via a surface annealing process.
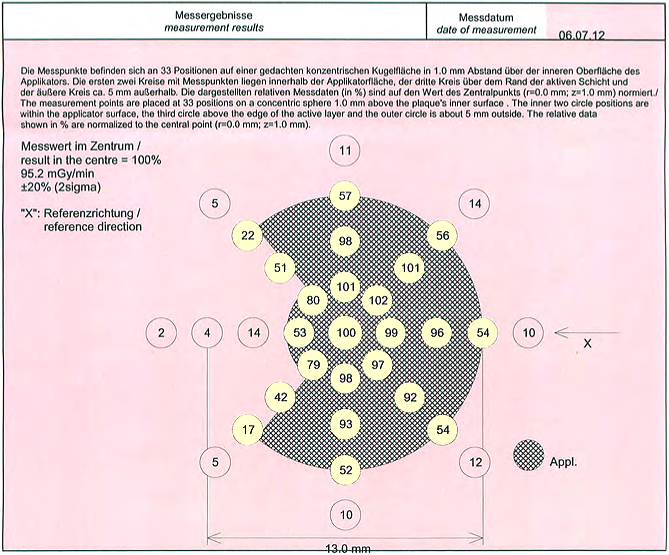
The BEBIG protocol sheet 2 of near-surface measurments. The measurements highlighted in yellow are the ones that will be entered into PS.

The PS Surface Measurements tab.
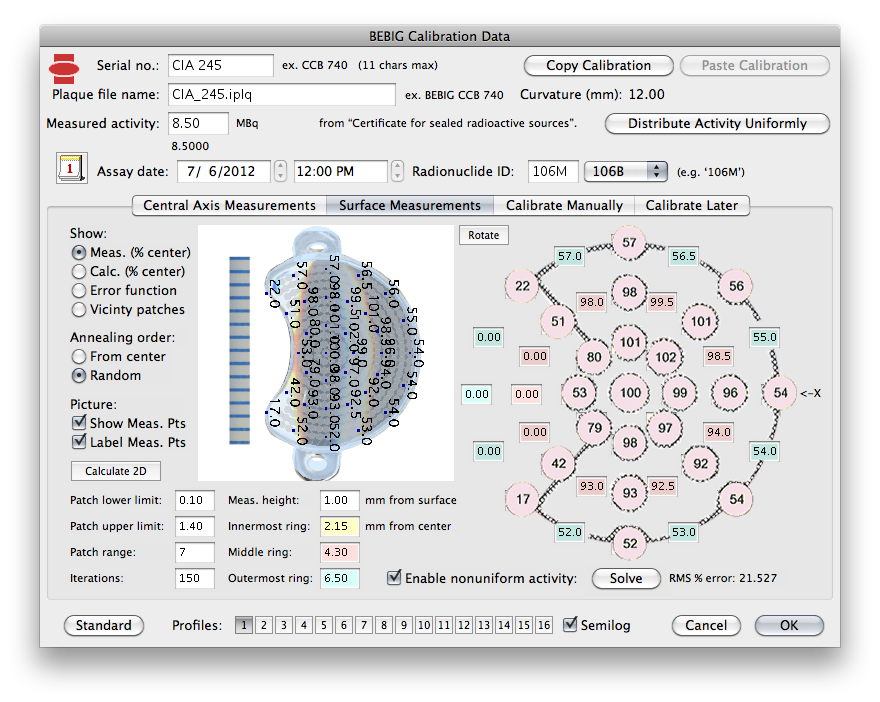
In this figure, the near-surface measurement points from the BEBIG protocol sheet are overlayed onto their corresponding PS data entry fields. The most distal ring of the protocol sheet, beyond the edge of the plaque, is not used by PS. Any PS data entry fields for which measurements are not provided on the protocol sheet MUST be approximated, for instance, by interpolating the measured points, or set to zero if they are outside the plaque perimeter or are not over a portion of the plaque where radionuclide is deposited.