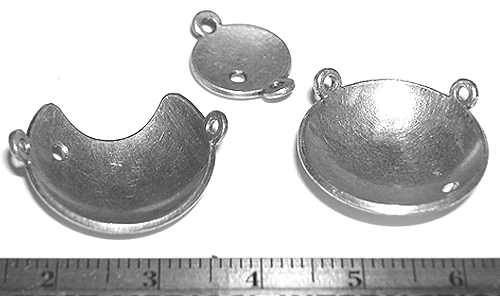
Figure 1a Ruthenium applicators model CCZ (top), CCB (right) and CIB (left). The small holes drilled in the shell mark these as dummy applicators.
Beta-ray emitting Ru-106/Rh-106 ophthalmic applicators have been used for close to 4 decades in the treatment of choroidal melanoma. The form factor of these applicators is a spherically concave silver bowl with an inner radius of curvature between 12 and 14 mm, and a total shell thickness of 1 mm. The radioactive nuclide is deposited in a layer 0.1 mm below the concave surface of the applicator. Calculation of dose distributions for clinical treatment planning purposes is complicated by the concave nature of the distributed source, the asymmetric shape of the active region of some applicators, imperfections in the manufacturing process which can result in an inhomogeneous distribution of activity across the active surface, and absorption and scatter in the 0.1 mm layer of silver which seals and protects the radioactive layer.
A semi-empirical method of calculating dose distributions for these applicators is described which is fundamentally compatible with treatment planning systems that use the AAPM TG43 brachytherapy formalism. Dose to water is estimated by summing a "patch source" dose function over a discrete number of overlapping patches uniformly distributed over the active surface of the applicator. The patch source dose function differs conceptually from a point source dose function in that it is intended to represent the macroscopic behavior of a small, disk-like region of the applicator. The patch source dose function includes an anisotropy term to account for angular variation in absorption and scatter as particles traverse the 0.1 mm silver window. It geometrically models the nearfield of a patch with properties akin to both a small disk and infinite plane, and models the farfield as if the patch were a point. This allows a manageable number of discrete patches (300 to 1000) to provide accuracy appropriate for clinical treatment planning. This approach has the advantages of using familiar concepts and data structures, it is computationally quick, and it readily adapts to asymmetric applicator shapes and inhomogeneities in the radionuclide distribution. A method for optimizing the patch source dose function parameters is presented, and the dosimetric calculations are compared with published Monte Carlo calculations and measurements.
Key words: beta dosimetry, dosimetry, eye plaques, ophthalmic applicators, rutheniumBeta-ray emitting Ru-106/Rh-106 ophthalmic applicators have been used for close to 40 years (1,2) in the treatment of choroidal melanoma. Sixteen standard models of Ru applicators are currently manufactured by BEBIG GmbH, Berlin, Germany. The form factor of these applicators is a spherically concave silver bowl with an inner radius of curvature between 12 and 14 mm, and a total shell thickness of 1 mm. Various shapes with diameters between 11.5 and 25.5 mm are available. Some of these applicators are illustrated in Figure 1, including additional detail for the popular 20 mm diameter model CCB. The radioactive nuclide is electrically deposited with an approximate thickness of 0.1 µm on the concave surface a 0.2 mm thick silver target foil. This target foil is, in turn, sandwiched between the concave surface of a 0.7 mm thick layer of silver (back) and the convex surface of a 0.1 mm thick layer of silver (window).
|
Figure 1a Ruthenium applicators model CCZ (top), CCB (right) and CIB (left). The small holes drilled in the shell mark these as dummy applicators. |
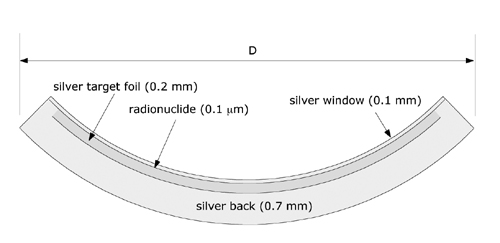
Figure 1b Cross section through the 20 mm diameter (D) model CCB applicator. |
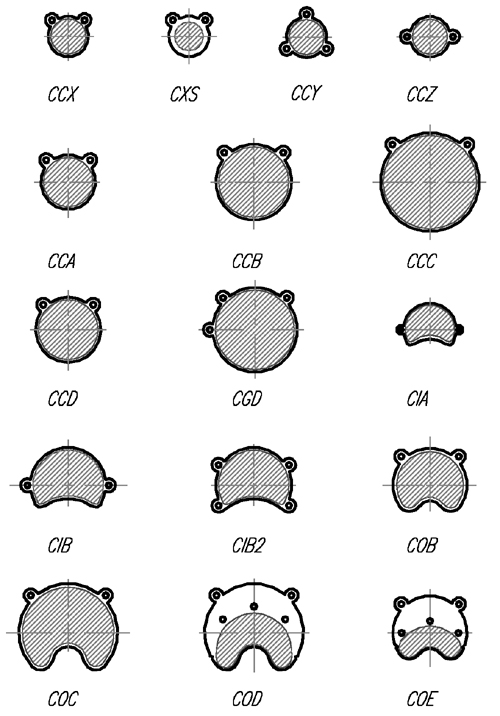
Figure 1c Schematic illustrations of most of the standard models. |
Ru-106/Rh-106 is an example of secular equilibrium. The Ru-106 parent (halflife 368 days) disintegrates via β- decay with a peak beta particle energy of 39 KeV to radioactive daughter Rh-106. The 90-percentile distance (the distance from a source within which 90% of the energy is absorbed) in water for Ru-106 is less than 0.008 mm (3) so these particles may be considered to be entirely absorbed in the 0.1 mm silver window. The primary contributor to therapeutic dose is the continuous spectrum of beta particles emitted in the decay of Rh-106 (halflife 30 s). Rh-106 disintegrates by β- decay with a mean beta energy of about 1.4 MeV and a maximum of 3.54 MeV to the stable element Pd-106. The 90-percentile distance for Rh-106 beta particles in water is 7.92 mm. (3) Backscatter from the 0.7 mm thick silver backing of the applicator tends to soften the spectrum, while attenuation in the 0.1 mm silver window tends to harden the spectrum of beta particles which are emitted from the concave surface of the applicator.
Beta-ray emitting Ru-106/Rh-106 ophthalmic applicators havebeen used for close to 4 decades in the treatment of choroidal melanoma. Theform factor of these applicators is a spherically concave silver bowl with aninner radius of curvature between 12 and 14 mm, and a total shell thickness of1 mm. The radioactive nuclide is deposited in a layer 0.1 mm below the concavesurface of the applicator. Calculation of dose distributions for clinicaltreatment planning purposes is complicated by the concave nature of thedistributed source, the asymmetric shape of the active region of someapplicators, imperfections in the manufacturing process which can result in aninhomogeneous distribution of activity across the active surface, andabsorption and scatter in the 0.1 mm layer of silver which seals and protectsthe radioactive layer.
A semi-empirical method of calculating dose distributions for these applicators is described which is fundamentally compatible withtreatment planning systems that use the AAPM TG43 brachytherapy formalism. Doseto water is estimated by summing a "patch source" dose function overa discrete number of overlapping patches uniformly distributed over the activesurface of the applicator. The patch source dose function differs conceptuallyfrom a point source dose function in that it is intended to represent themacroscopic behavior of a small, disk-like region of the applicator. The patchsource dose function includes an anisotropy term to account for angularvariation in absorption and scatter as particles traverse the 0.1 mm silverwindow. It geometrically modelsthe nearfield of a patch with properties akin to both a small disk and infiniteplane, and models the farfield as if the patch were a point. This allows amanageable number of discrete patches (300 to 1000) to provide accuracyappropriate for clinical treatment planning. This approach has the advantagesof using familiar concepts and data structures, it is computationally quick,and readily adapts to asymmetric applicator shapes and inhomogeneities in the radionuclidedistribution. A method for optimizing the patch source dose function parametersis presented, and the dosimetric calculations are compared with published MonteCarlo calculations and measurements.
Calculation of dose distributions for treatment planning purposes is complicated by the concave nature of the distributed radioactivematerial, the asymmetric shape of the active region of some applicators,imperfections in the manufacturing process which may result in an inhomogeneousdeposition of activity across the active surface, and absorption and scatter in the 0.1mm silver window. From a dosimetric perspective, the volume of greatestinterest begins at the concave surface of the applicator and extends radiallyinward to a distance of about 8 mm in "front" of the applicator.
There is a moderate volume of recent literature dealing with approaches to measurement (4,5,6,17,18,19,21)and calculational models (7,10,17,18,20)of the dose distributions surrounding these applicators. Physical measurementis complicated because the region of therapeutic interest is less than 25 mm across and falls within a few mm of the applicator surface where the dosegradient is steep. This mandates very small non-perturbing detectors, precisepositioning and careful determination of the effective point of measurement. Fluhs et al (6) have described a measuring systemwhich mechanically scans the distributionof dose rate surrounding an applicator in three dimensions (3D) using asmall volume (1 to 10 mm3) plastic scintillator detector. This 3D dataset is used directly in theirtreatment planning process. Soares et al(5) recently published acomparison of eight measurement methods which included radiochromic film andplastic scintillators. Hokkanen et al (7)proposed a numerical integration of the beta point source functionoriginally derived by Loevinger (8) and later refined by Vynckier and Wambersie (9). Their approach, as described, was restricted to radionuclide distributionswhich were cylindrically symmetrical around the central axis of the applicator.Various groups (10,17,18,20) have experimented with Monte Carlo models for beta applicator dose calculations. Monte Carlo models have the advantage, in principle, of being able to elegantly deal with applicator and tissueinhomogeneities and can produce excellent results when compared to measurement, but they are time consuming to develop and compute, and their complexity makesthis approach difficult to incorporate and support in a practical treatmentplanning system at this time.
A comparatively simpler methodology is presented here in which dose to water is estimated by summing a "patch source" dose function (kernel), derived from a combination of Monte Carlo modeling and empirical measurements, over a discrete number of overlapping patches uniformlydistributed over the active surface of the applicator. The patch source dose function, as introduced here, differs conceptually from the classic point source dose function in that it is intended to represent the macroscopic behavior of a small, disk-like region of radionuclide. The patch source dosefunction includes an anisotropy term to account for the angular variation inscatter and attenuation as particles traverse the 0.1 mm silver window. It geometrically models the nearfield of a patch with properties akin to both a small disk and infinite plane, and the farfield as if the patch were a point. This allows a manageable number of discrete patches (300 to 1000) to provide the accuracy required for clinical treatment planning in the volume of interest. The approach has the advantages of using familiar concepts and data structures, it is computationally quick, and easily adapts to asymmetric applicator shapes and inhomogeneities in the radionuclide distribution.
Beginning in May, 2002, the manufacturer of the Ru applicators introduced a new NIST traceable calibration protocol with reduced uncertainty which includes dose rate measurements at up to 33 points near the applicator surface and 11 points on the applicator central axis. This replaces an earlier 4 point calibration protocol (0, 2, 3.5 and 5 mm) with a stated uncertainty of 30% which had been in use for many years.
The 11 central axis measurements used in this study were obtained at distances from 0.7 to 10.7 mm in 1 mm increments. The manufacturer anticipates that, beginning in 2003, the 11 point central axis protocol will change to a measurement at 0.6 mm, and measurements from 1.0 through 10.0 mm in 1 mm increments. These measurements are made using a 1 mm diameter, 0.5 mm height scintillator detector in a water phantom. The overall uncertainty in this new measurement protocol is stated by the manufacturer to be 20%.
An existing 3D ophthalmic plaque dosimetry simulator, (11,12,13,14) originally developed for modeling the dosimetry of ocular tumors using gold plaques containing I-125 seeds, was modifed to study the Ru applicators and their dosimetry. This software is distributed under the title "Plaque SimulatorŞ" by BEBIG GmbH, Berlin, Germany and runs on Apple MacintoshŞ personal computers under either OS-9 or OS-X.
The distribution of radioactive nuclide in a Ru applicator is approximated using a discrete number of overlapping patches (300 to 1000) uniformly distributed over the active area of the applicator. Asymmetrically shaped and notched applicators (eg model CIB, Fig. 1a) are modeled by first calculating a patch distribution for the closest symmetric shape and then deleting patches whose centers fall in the notched or asymmetric regions. This is a scripted process for the 16 standard applicators, and may also be performed manually in order to prototype new designs.
The radionuclide in these applicators is deposited in a 0.1 µm thick layer on the concave side of the target foil, 0.1 mm below the concave surface of the applicator. In the course of developing the patch model, positioning the patch center 0.2 mm below the concave surface of the applicator was found to yield the best fit of the model to physical measurement. For this reason, the "effective center" of a patch happens to fall in the middle of the silver target foil, 0.2 mm below the concave surface of the applicator. The distance between patch centers is typically about 0.6 mm. The extent of patch overlap is determined by a pair of nearfield-farfield crossover parameters which are discussed below.
The dose rate at a point p in water surrounding an applicator is estimated by summing the dose rate delivered to that point from all of the patch sources. The instantaneous dose rate from any individual patch source can be expressed, in a manner analagous to the AAPM's TG43 (15) interstitial brachytherapy formalism, as:
D(r,θ) = S(s,t) * A * g(r) * G(r) * F(r,θ) (1)
where
r = distance between point p and patch s. This is estimated as the distance between p and the effective center c of each patch (see Fig. 2).
f = the angle between a vector n normal to the patch (ie from c towards the center of the sphere to which the applicator conforms) and a vector from c towards p.
S(s,t) = source strength (Bq) of patch s at time t.
A = a calibration constant for the applicator.
g(r) = a radial dose function which returns nGy/Bq-h.
G(r) = a geometry function.
F(r,θ) = ananisotropy function.
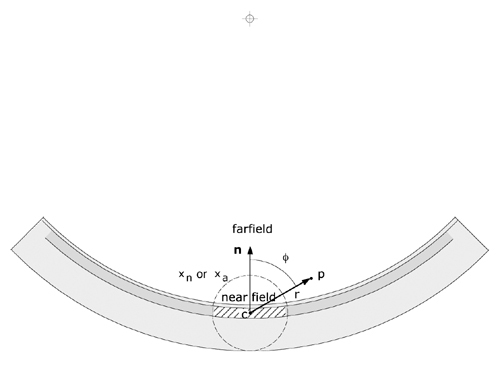
Figure 2 The angle θ, used to calculate F(r,θ), is defined as the angle (range 0..180 deg.) between a vector n originating at the effective center c of a patch and directed towards the center of the sphere to which the applicator conforms, and a vector from c to the dose calculation point p. The distance r between c and p is used to calculate the radial dose function g(r) and the geometry function G(r). The applicator is assumed to curve away symmetrically from n. The extent of a patch (hatched area) and its overlap of other patches is related to the nearfield (xn or xa)boundry. |
By default, the radionuclide is considered to be distributed homogeneously. Since all patches are considered to be the same size, the source strength S (Bq) of each patch is simply the apparent total activity of the applicator (as specified by the manufacturer) divided by the number of patches. The total activity may optionally be distributed inhomogeneously among the patches.
Calibration constant A
The calibration constant A for the applicator is an empirically determined, dimensionless factor, typically in the range 0.9 to 1.1, which scales the calculation to match the measured dose rate at a point on the applicator's central axis approximately 5 mm from the applicator surface. The calibration point location is derived by averaging all measurements of central axis dose rate which fall in the range 4 to 6 mm on the manufacturer's "protocol of measurements" sheet which accompanies each applicator.
Radial dose function g(r)
The radial dose function g(r) accounts only for the effects of scatter and absorption in water between a patch and calculation point p. It is similar to the radial dose function for interstitial brachytherapy seeds as described in TG43. The current implementation of the patch source radial dose function assigns all of a patch's activity to a point at its effective center, so that r can be simplified to the distance between point p and the effective center c of each patch (see Fig. 2). This allows g(r) to be estimated from a beta point source dose function such as Table VI in Cross et al (10) which was calculated using a Monte Carlo model and gives the dose rate per unit of source activity (nGy/Bq-h) at any distance greater than 0.02 mm from a point source in water. Alternatively, the beta point source dose function can be implemented from empirically derived expressions (3,8,9,16,22) which yield similar results.
Geometry function G(r)The geometry function G(r) is a unitless quantity, unique to each applicator, which accounts for the macroscopic variation of relative dose due only to the distance r (see Fig. 2) between a calculation point and a patch, ignoring absorption and scattering. The simplest geometry function is the inverse square factor:
G(r) = 1 / r2 (2)
which treats each patch as if it were a point located at c. The problem with the inverse square factor is that for points very close to c, the values of G(r), and hence the calculated dose, become very large. This results in islands of erroneously high values (hot-spots) on the concave surface of an applicator. Intuitively, one can appreciate that for points extremely close to the applicator surface, the distributed source may be considered akin to an "infinite" plane, a situation in which there is no geometric divergence and the geometry function G(r) must therefore be closeto 1.
Let us next consider a patch to be a small, thin circular disk with uniform surface activity and radius R. Let us also assume that the macroscopic geometry factor G for dosimetry point p can be calculated by integrating differential contributions dG resulting from surface elements ds over the surface of the disk, and that dG is the inverse square factor 1 / d2 where d is the distance from ds to p. If point p is at distance r on the axis of the disk we can take advantage ofthe symmetry and consider the disk to be composed of rings of radius a and width da centered on the disk. Each ring has a differential area dA = 2π a da, and d2 = r2 + a2. Ignoring the constant π and integrating the rings over the range 0 to R we get:
G(r) =0∫R (2ada / (r2 + a2)) = ln((R2 + r2)/ r2) (3)Equations (2) for a point source and (3) for a disk source of radius R = 1 mm are plotted in Fig. 3. For r > 1.5 mm these two functions are nearly equivalent. The latter function (3) will clearly improve dose calculations at r < 1.5 mm but still results in unacceptable "hot-spots" on the applicator surface which lies at roughly r = 0.2 mm.
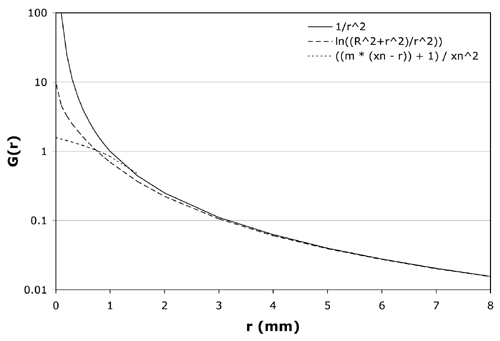
Figure 3 Candidate equations for the geometry function G(r) are plotted over the range 0 to 8 mm. The solid line is the inverse square function (equation 2) for a point source, the dashed line is the logrithmic function (equation 3) for a disk source of radius R = 1 mm, and the dotted line is the linear function (equation 4) for the model CCB applicator with crossover distance xn = 1.65 mm and slope m = 2. For r > 1.5 mm these 3 equations are nearly equivalent. Equation 4 best reproduces measured dosimetry. |
The geometry function selected for the patch source model instead divides r into two ranges, a nearfield and a farfield, and requires a pair of empirically determined parameters. The nearfield boundry corresponds very roughly to the extent of a patch (see Fig. 2). The nearfield and farfield intersect at a distance xn which will be referred to as the nearfield crossover distance. The parameter xn is limited to a maximum of 4 mm from the effective center of a patch so as not to overlap the calibration point. In the farfield (r > xn), G(r) evaluates to the inverse square factor 1 / r2, ie the patch is treated as a point. In the nearfield (r <= xn), the patch is geometrically treated somewhere between a small disk (r ≈ 1 mm) and a plane (r ≈ 0 mm) and G(r) evaluates to the linear equation:
G(r) = ((m * (xn- r)) + 1) / xn2 (4)At the crossover distance, r = xn,both equations evaluate to 1 / xn2.The optimal crossover distance xnand slope m were found to vary somewhat with applicator shape and size and are empirically determined for each applicator by minimizing the square of the residuals between calculated values and the 11 dose rate measurements on the central axis provided by the manufacturer. Also plotted in Fig. 3 is equation (4) for xn = 1.65 mm and m = 2.0, values typical of the model CCB applicator (see Table 1). With these values for xn and m, G(r) is constrained to a value of 1.4 at the applicator surface and is similar to the disk source function (2) at r ≈ 1 mm.
Anisotropy function F(r,θ)
The anisotropy function F(r,θ) is another unitless quantity which is intended to account for the macroscopic angular differences in scatter and absorption of the beta particles eminating from a patch as they cross the 0.1mm silver window. As illustrated in Fig. 2, the angle θ is defined as the angle between a vector n originating at the effective center c of a patch, 0.2 mm below the concave (inner) surface of the applicator, and directed towards the center of the sphere to which the applicator conforms (ie a normal to the inner surface of the applicator) and a vector in any other direction from c. If the extent of a patch is small compared to the size of the applicator, the applicator can be considered to curve away symmetrically in all directions perpendicular to n, and F(r,θ) can be implemented as a 2 dimensional function. The anisotropy function is normalized to a value of 1.0 in the direction n which represents the minimum path through the applicator.
The beta-ray dose distributions in low Z materials (Z <= 18) other than water have been demonstrated to have nearly the same shape,differing only by a "scaling factor" and a related renormalization factor.(24) Cross et al(10) theorized that the dose rate as a function of distance from a point source of beta particles in infinite homogeneous silver (Z=47) could be estimated from an equivalent path length of pseudo-water with a specific gravity 13.4. For instance, the attenuation of 0.1 mm of silver would be equivalent to 1.34 mm of water. This was modeled for a planar source using a Monte Carlo code. Their results show that the relative axial distributions are fairly close, differing by a small amount that increases with distance. This was attributed to the harder spectrum of betas transmitted by the silver window. The angular distribution of betas transmitted by the window, however, was found to be virtually the same for silver and an "equivalent" layer of water.
A first approximation for the patch source anisotropy function was created by calculating the linear path length through silver from c as a function of angle for a spherical silver shell whose radius of curvature is 12 mm and total thickness 1 mm. The beta point source dose function of Cross et al (10) was used to estimate relative dose from an equivalent depth of water. This simplification also assumes that the beta particles leaving point c lose energy without serious loss of direction as they cross the silver window, whereas, in fact, beta particle trajectories quickly become rather tortuous. The beta particles, however, do not all originate from point c, rather, they eminate uniformly from across the patch. It was theorized that, on a macroscopic scale, particles deflected from a straight path through the silver would be replaced by particles that originated elsewhere in the patch. If this "angular equilibrium" exists, then an anisotropy function for the patch could be approximated from a single point.
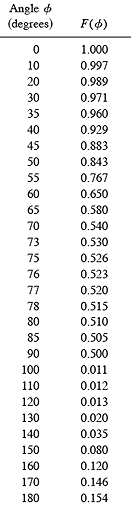
When compared to published Monte Carlo calculations and measurements,(5,10,17) the anisotropy function approximated from a single radiating point at the effective center of a patch was found to overestimate attenuation at angles nearly perpendicular to n (ie angles nearly tangent to the concave surface of the applicator). The anisotropy function for these angles was empirically adjusted to force the patch source calculations to match published Monte Carlo calculations and off-axis measurements just outside the peripheral edge of the 20 mm diameter model CCB applicator. The values used in this study are listed in Table 2.
The anisotropy function is managed by three parameters, a crossover distance xa (≈ 2.0 mm) which delineates between a nearfield and farfield, a bias(23) parameter which governs the rate of transition (1.0 / ((((1.0 / bias ) - 2.0) * (1.0 - (r / xa))) + 1.0)) from nearfield to farfield, and an angular shift (expressed in degrees) which is added to angle θ to account for manufacturing differences between individual applicators and applicators whose spherical radius of curvature is greater than 12 mm. In the nearfield of a patch, the anisotropy function is constrained to remain close to 1.0 at all angles. In the farfield, where the patch can be treated as a point, the full correction is applied. The optimal crossover distance, bias and shift vary somewhat with applicator shape and size and are also determined for each applicator by minimizing the square of the residuals between calculated values and the 11 dose rate measurements on the central axis provided by the manufacturer.
RESULTSOne method of optimizing the patch source kernel parameters is to manually adjust them and observe how well a calculated central axis depth dose curve fits the measured values. The quality of fit can be expressed as the root-mean-square (RMS) percent error of the residuals. The order in which the parameters are optimized was found to influence the amount of time required to achieve a satisfactory fit. A scripted sequence was developed which requires no more than a couple of minutes computing time on a 1GHz computer.
The optimization process consists of first estimating the calibration constant A with the remaining parameters initialized to predefined values close to those anticipated from experience. For instance, the optimal nearfield-farfield crossover parameters xnand xa generally fall close to 2 mm, so they are initialized to that distance. In addition, the calibration point itself was intentionally selected to be at about 5 mm depth on the central axis so that the geometry and anisotropy functions would exert only a weak influence on the calibration. In the second step, the two geometry function parameters (xn and m) are simultaeously optimized to minimize the RMS error in the nearfield. The anisotropy function parameters bias, shift and xaare then optimized individually and in that order. The calibration and geometry function parameters are then fine tuned ina second optimization pass.
"Protocol of Measurements" sheets for 24 applicators representing 13 of the 16 standard models were provided by the manufacturer for this study and the data entered in the planning software. The required data consists of the nominal source activity (MBq), the calibration date, 11 measurements (at 1 mm increments from 0.7 to 10.7 mm) of central axis dose rate (mGy/min), and the manufacturer's estimate of surface dose rate at 0mm on the central axis which is derived from a regression of the other measurements. Calibration parameters and quality of fit were calculated using the scripted optimization sequence described above. The results are listed in Table 1.
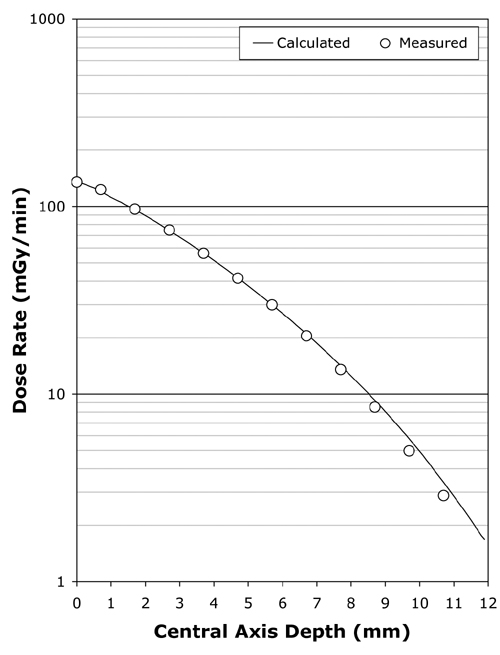
Figure 4 Following kernel parameter optimization, the calculated central axis depth-dose curve typically fits the manufacturer's central axis measurements over the range 0 to 7 mm with an RMS error of less than 2%. Illustrated here is the fit achieved for applicator CCB 975. |
Using the scripted optimization process, a clinically acceptable fit to the central axis measurements was always achieved, with an RMS error of under 2% in the majority of cases. The fit achieved for applicator CCB 975 is plotted in Fig. 4. Slightly better fits were achievable in some instances by manually adjusting parameters in increments smaller than those employed in the scripted procedure. As illustrated in Fig. 5, the greatest variability in quality of fit occurred for the smallest diameter applicators.
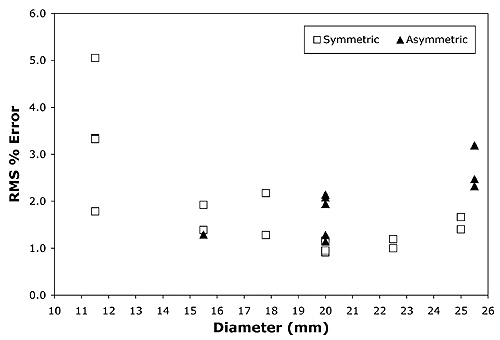
Figure 5 The scripted optimization process in most instances achieved a fit with an RMS error of lessthan 2% over the range 0..7 mm. The widest variation of fit quality was for thesmallest diameter applicators. |
Two dimensional dose distributions and off-axis profiles were calculated and compared with published calculations(10) and measurements (5,17) for two applicators, the symmetric model CCB and the asymmetric model CIB. These two applicators ar eillustrated in Fig. 1(a).
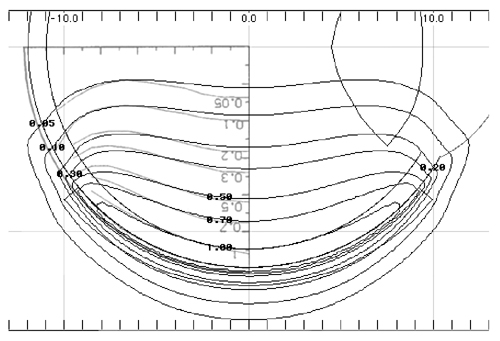
Figure 6 A calculated isodose distribution (black lines) in a plane through the central axis of applicator CCB 975 is superimposed on the Monte Carlo calculation (graylines, upside down text) Fig. 7 from Cross et al (10) for applicator CCB 511. The dosimetry has been normalized to a value of 1.0 on the central axis at a distance of 1 mm from the applicator surface. |
In Fig. 6 isodose lines calculated using the patch source model for applicator CCB 975 are superimposed onto Monte Carlo calculated isodose lines redrawn from Fig. 7 in Cross et al (10)for applicator CCB 511. In each instance the isodose lines have been normalized to a value of 1.0 on the central axis at a distance of 1 mm from the applicator surface. The two methods yield very similar results.
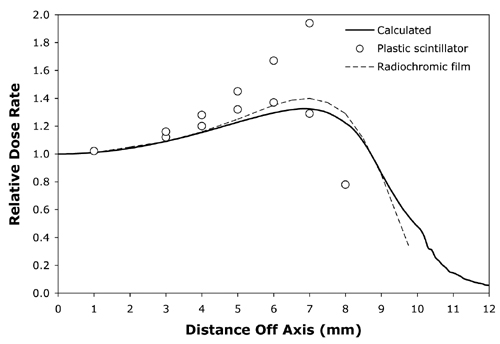
Figure 7 The solid line isa calculated off-axis profile at 5mm from the surface of applicator CCB 975.The open circles are plastic scintillator measurements and the dashed lineplots radiochromic film measurements redrawn from Fig. 11 in Soares et al(5) for applicator CCB 511. |
Normalized off-axis profiles at 0.5, 1, 1.5, 2, 3, 4, 5, 7 and 10 mm from the surface of applicator CCB 975 were calculated and compared to the normalized off-axis measurements of Soares et al 5 for applicator CCB 511, again with similar results at all distances. As an illustrative example, Fig. 7 compares the calculated off-axis profile at 5 mm for CCB 975 with off-axis measurements at 5 mm depth for CCB 511 obtained from radiochromic film and a plastic scintillator detector. The measured data was redrawn from Fig 11 in Soares et al(5).
Taccini et al (17) measured isodose distributions using radiochromic film for an asymmetric applicator (model CIB 110). The patch source model yielded similar results to their measurements as well. As an illustrative example, Fig. 8 superimposes a calculated isodose distribution (black lines) in plane B which bisects applicator CIB 275 through the central axis, onto radiochromic film measurements (gray symbols) in the same plane redrawn from Fig 4c in Taccini et al (17). The dosimetry is normalized to the surface dose at the central axis.
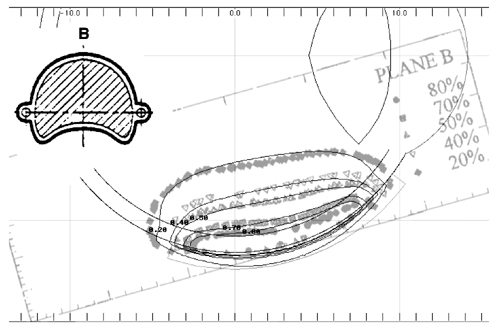
Figure 8 A calculated isodose distribution (black lines) in the B plane through the central axis of applicator CIB 275 is superimposed on the radiochromic film measurements (gray lines) redrawn from Fig. 4c of Taccini et al(17)for applicator CIB 110. |
The computational model described here intentionally follows a formalism similar to that recommended by AAPM TG43 (15) for interstitial brachytherapy sources such as I-125 seeds. That similarity allowed software and data structures originally designed for TG43 calculations to be adapted to the beta emitting Ru plaque. Some changes in the software source code and data structures were required to deal with the nearfield/farfield dichotomy in the G(r) and F(r,θ) functions, and in calculating the angle θ. New code was required to provide a user interface for optimization of the kernel parameters.
For I-125 seeds and other cylindrically symmetric linear sources such as those used as examples in TG43, the anisotropy function F(r,θ) can assume four quadrant symmetry and therefore only needs to be defined over a 90 deg. range. As used here, the anisotropy function has two quadrant symmetry and hence must be defined over a 180 deg. range. This occurs because the radioactive source layer is closer to the concave surface of the applicator. By defining the anisotropy function over a full 180 deg. range, absorption in the applicator back layer is accounted for. This greatly simplifies the calculation of a complete 3D dose distribution surrounding the applicator, including back and sides, since no additional computations are required to account for absorption in the applicator shell. A change was required in the anisotropy data structure, extending it to cover a range of 180 deg.
The accuracy of the calculation appears to compare well with published examples of Monte Carlo calculations and isodose measurements for two models of applicator (5,10,17). It is anticipated that the method will compare equally well with measurements of other applicator models, and the manufacturer of the applicators should be encouraged to support such studies. A particularly interesting future study would be direct measurement of F(r,&theta) for an experimental applicator which containsonly a single "patch" of radionuclide.
The patch source calculation was found to be computationally quick. It requires only a few minutes to calibrate and optimize the kernel parameters and only a few seconds to calculate two and three dimensional dose distributions suitable for clinical treatment planning using a 1 GHz class personal computer. The applicator calibration and kernel optimization is a one-time process performed upon receipt of a new applicator. The optimized parameters are stored in a file named for the applicator which is then simply reloaded as needed.
The patch source model adapted easily to asymmetric and notched applicator shapes and is fully capable of modeling inhomogeneities in the radionuclide distribution of the applicators as well. The practical problem with modeling a heterogeneous radionuclide distribution is measuring and subsequently managing the data. In the present version of the software (5.09), source heterogeneity must be handled by manually editing the source strength of each patch, a cumbersome process. In order to make this a manageable task, it is anticipated that the radionuclide distribution can be approximated reasonably well using only a practical subset of near-surface measurements, far fewer than the hundreds of "patches" required to model the surface.
As part of its documentation accompanying each applicator,the manufacturer presently provides up to 33 dose rate measurements at 1 mm above the applicator surface, normalized to the applicator center. These measurements are made using a 1 mm diameter, 0.5 mm height scintillator detector in a water phantom. Although the precise coordinates of the detector are known to the manufacturer, at the time of this study they were not well documented on the data sheets that accompany an applicator. Only approximate radial distances and angular directions were provided. In the future, with better documentation of the detector coordinates, these measurements could be used in conjunction with an "inverse" dosimetry algorithm to estimate the radionuclide source distribution. An alternative would be to acquire a full 3D high resolution dataset in the manner of Fluhs et al(6) and provide the data in electronic form with each applicator. This is a somewhat time consuming process that might increase the manufacturing cost of anapplicator.
As illustrated in Fig. 5, central axis fit does not appear to be influenced by applicator symmetry, yielding similar quality-of-fit results for both symmetric and asymmetric (notched) applicators. Instead, the greatest variation in quality-of-fit between calculation and central axis measurements occurred for the smallest diameter applicators. This may be related to the smaller number of patches used to model those applicators, or perhaps to the anisotropy function. The original philosophy was to keep the patch areal density roughly the same, and to try and use a common F(r,θ) anisotropy function for all the different applicator models. The influence of patch density will be investigated further, as will continued refinement of the anisotropy function, inhomogenity mapping and methods of optimizing the parameters.
The patch source model described here compares well with published calculations and measurements for the models CCB and CIB applicators. The model appears to provide results appropriate for 2D and 3D clinical dosimetry tasks with all of the standard Ru applicators, particularly in lightof a 10% to 15% uncertainty of the measurements themselves.(5) Simplification of the process required to model surface heterogeneity and further comparisons with Monte Carlo calculations and measured dose distributions of applicators, particularly the smallest diameter models, are logical progressions of this work.
The author wishes to thank W.G. Cross for his considerable and invaluable contributions to the field of beta-ray dosimetry and for clarifying some issues regarding the Monte Carlo calculations described in his publications. Thanks are also due the BEBIG company for providing copies of "protocol of measurement" sheets from many of their applicator models.
a) Author to whom correspondence should be addressed. Department of Radiation Oncology, 1441 Eastlake Ave, Los Angeles, CA 90033; Tel. 323-865-3091; Fax: 323-865-0000; electronic mail: astrahan@usc.edu.
|
Table 1 Optimization parameters for 24 applicators representing 13 of the 16 standard models. 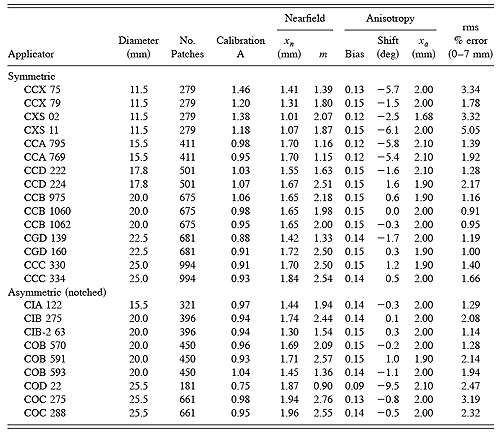
|
|
Table 2 Farfield (r > xa)anisotropy function F(θ) values used in this study. See text and Fig. 2 for explanation. |