The custom pseudo color palette is used (by default preference setting) when reconstructing a spheroidal surface from 3D CT imaging to the retinal diagram. The 8-bit pseudo color palette transforms the 256 possible gray levels of a monochrome reconstruction into colorized shades for enhanced display purposes. The custom palette supports 8 color transitions.
- 8-bit index - These 8 text fields set the palette indexes associated with the 8 transition colors. Palette indexes range from 0 to 255. The index values are calculated and set automatically when the custom palette is in Auto mode.
- Color - These 8 color wells set the colors associated with each of the 8 palette transition colors. When the palette is in Auto mode only colors 4 and 5 are used. The other colors 1,2,3 and 6,7,8 are automatically constrained to calculated shades of gray.
- Tint center slider - Sets the palette index (2..253) of the automatic palette tint center.
- Tint range slider - Sets the index range (2..32) of the automatic palette.
- SSR histogram - If an MPR image series has been loaded and a spheroidal surface reconstruction (SSR) is currently being displayed in the Retina Diagram Window, this view plots a histogram of the 8-bit pixel values in the reconstruction. The red line plots the MPR image enhancement gamma curve which is set in the MPR Window.
- Clip margin slider - Sets the clipping range (0..10 mm) for pseudo color tinting.
- Opacity slider - Sets the opacity of pseudo coloring.
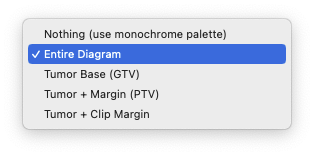
- Clip tinting to menu - Apply pseudo coloring to either nothing (use monochrome palette), the entire retinal diagram, the tumor GTV base, PTV (GTV base + margin) or the GTV base + clip margin distance.
- Auto - Enables automatic palette configuration based on the center and range slider settings. Automatic mode creates a palette using two transition colors (colors 4 and 5 which by preference settings default to shades of brown) surrounded by gray levels for colors 1,2,3 and 6,7,8. The indexes of colors 1 and 8 are constrained to values of 0 and 255 respectively.
- Show clip margin - Plots the pseudo color clipping margin surrounding the tumor base on the retinal diagram.