Up to 16 dose profile lines can be enabled from the Planar Dosimetry window:
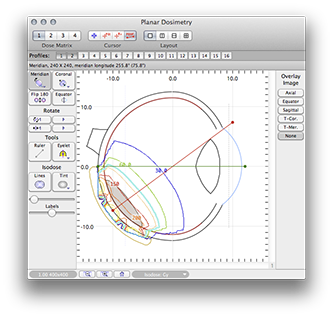
To enable a profile line, simply click its button and then drag the endpoints of the line on the plot. In this example, profiles 1 and 2 have been enabled.

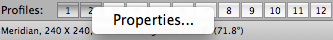
To edit profile lines select the profile cursor tool.

When the cursor is in profile mode, all enabled profiles and their endpoints are projected onto the planar surface as dashed lines. The endpoints relocate in 3D space to the current plane when you drag them.
You can place the endpoints anywhere in 3D space by rotating or translating the planar dosimetry surfaces and then dragging the projected endpoints of enabled profile lines.
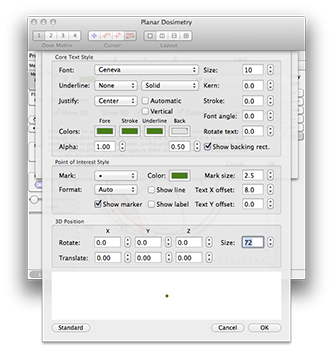
To set profile properties you can either double-click on a profile endpoint using the profile cursor, or control-click (equivalent to right mouse button) a profile button to reveal a contextual menu. From the menu select Properties... to open the profile properties sheet.
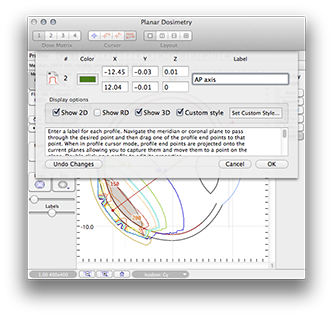
In the profile properties dialog sheet you can name the profile, change its color and coordinates, and choose where to display the profile.
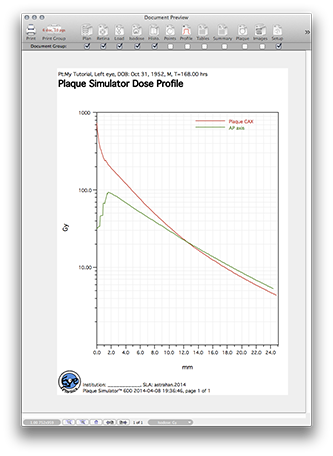
Dose profiles are plotted in the Profile Document.
In the profile properties sheet you can also change the font properties by enabling Custom Style and clicking the Set Custom Style button to open the custom style sheet. In this example, the font size for 3D rendering has been increased to 72 from its default value of 36 to enlarge the labels in the Patient Setup window.
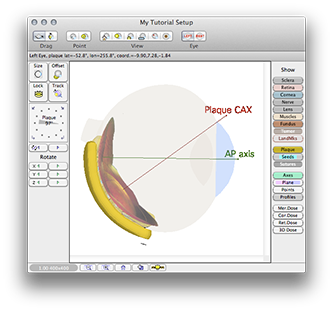
The profile lines can be displayed three dimensionally in the Patient Setup window by enabling the Profile button.