The isodensity tables and color palettes enable you to assign different tinting colors to 16 density bands (sub-ranges) in the image. To enable isodensity tinting click the Isodensity button. Isodensity bands can be enabled and disabled individually by clicking the cursor in the color boxes located in the lower left corner of an image window. Disabled bands are marked with an "X".![]() You can quickly edit a color by option-clicking on its box. The colors can be cycled left by control-clicking and right by command-clicking in any box. Isodensity contouring is disabled by default since it is much slower than tinting. Contouring and/or tinting can be individually enabled from the Isodensity Options menu.
You can quickly edit a color by option-clicking on its box. The colors can be cycled left by control-clicking and right by command-clicking in any box. Isodensity contouring is disabled by default since it is much slower than tinting. Contouring and/or tinting can be individually enabled from the Isodensity Options menu.
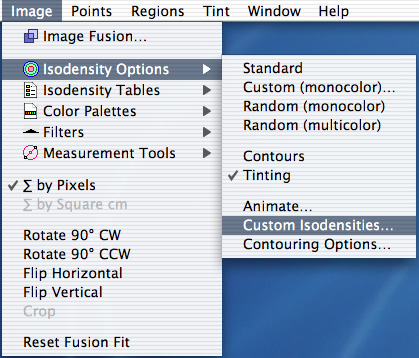 To edit the isodensity contour table select the Isodensity Options item from the Image menu or control-click (or click and hold) on the Isodensity button. Select Custom Isodensites... from the menu.
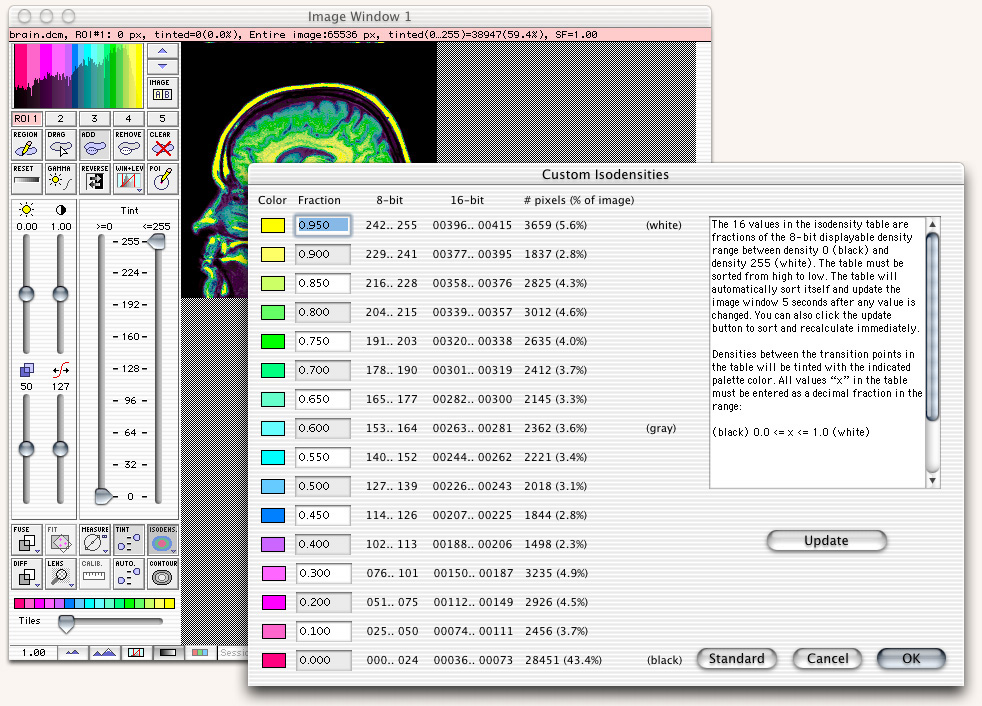
The 16 values in the isodensity table are fractions of the 8-bit displayable density range between density 0 (black) and density 255 (white). The table must be sorted from high to low before you exit the dialog. The table will automatically sort itself and update the image window 5 seconds after changing a value. You can also click the Update button for faster response. Densities between a transition value and the next higher value in the table will be tinted with the indicated palette color. All values (x) in the table must be entered as a decimal fraction in the range: (black) 0.0 <= x <= 1.0 (white)
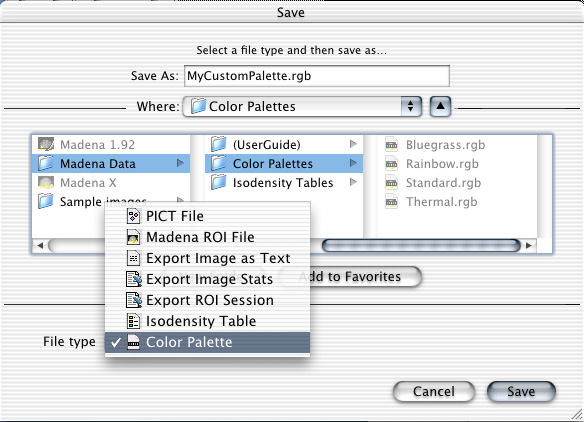
To save a custom isodensity table or color palette that you have created, select Save As... from the File menu, choose appropriate file type from the popup menu in the dialog, and then save the file in the appropriate location in the Madena Data folder. Saving a color palette in the palettes folder is illustrated below.
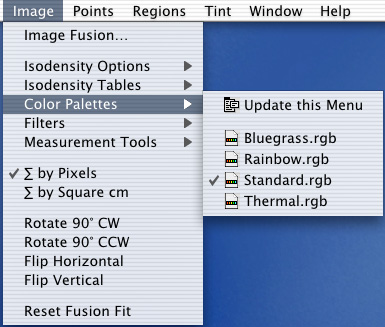
To load custom isodensity tables or color palettes that you have created and saved, select your table or palette from the Image menu. You can also choose a table and palette to use as the program default via the preferences dialog.
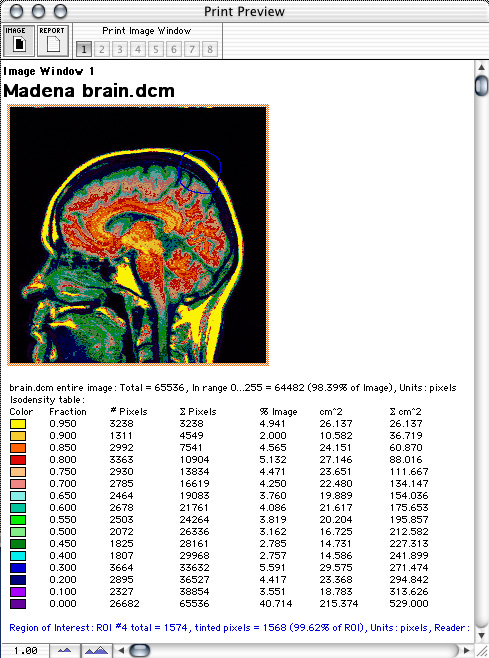
Isodensity area calculations are displayed both in the isodensity dialog and in more detail in printed documents. To show isodensity data on a document you must first enable the Show image analysis checkbox in the document preferences dialog. A document can be previewed by selecting Print preview from the Window menu. You can also control-click the edit menu to copy isodensity data to the clipboard.