RESULTS
A. Test case 1
(a)
(b)
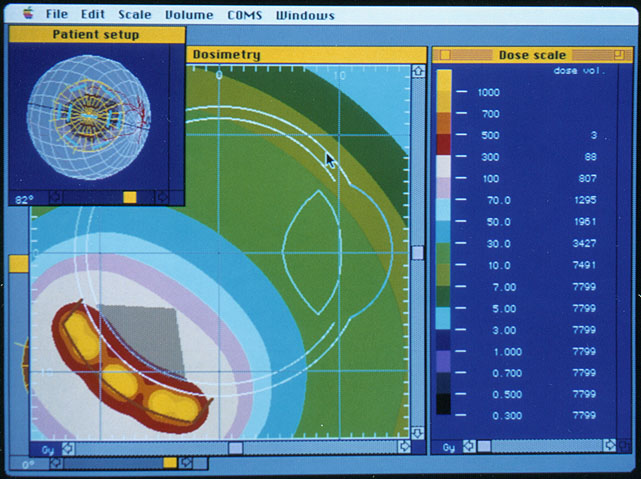
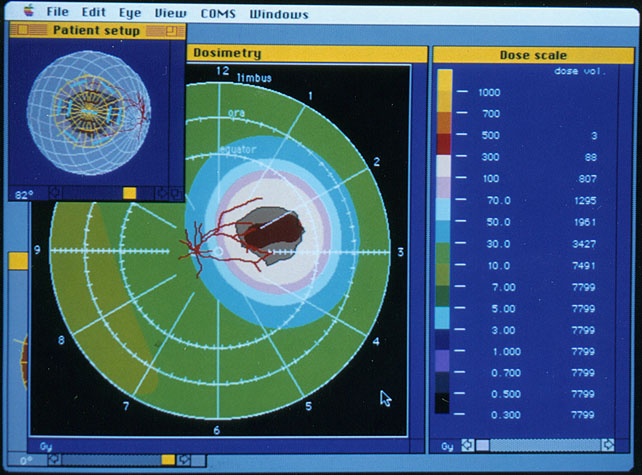
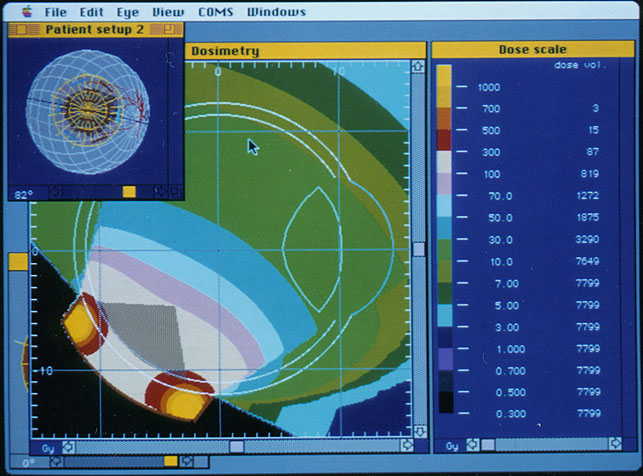
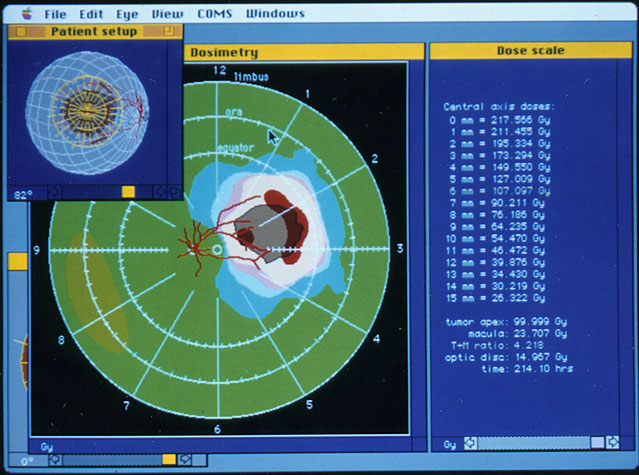
FIG. 1. Test case 1: The calculated dose distributions and dose volumes for nine seeds in a 14 mm diameter plaque are plotted for (a) the transecting plane and (b) the retinal surface. Shielding provided by the gold shell is ignored in these calculations.
The dose distribution for nine 4 mCi seeds in a somewhat arbitrary selection of slots was calculated in a transecting plane as well as on the retinal surface. In this case, shielding by the gold shell was ignored. These calculations are plotted in Fig. 1. Rulers in the window labeled "Dosimetry" are scaled in 1 mm increments with major cross-hairs every 10 mm. The color scale represents integrated dose in Gy. The dose volume histogram is displayed also in the "Dose scale" window. The volume of eye tissue receiving a dose in excess of 100 Gy was calculated to be 807 mm³ and the 300 Gy volume was calculated to be 88 mm³. The T:M ratio is 1.6.
B. Test case 2
(a)
(b)
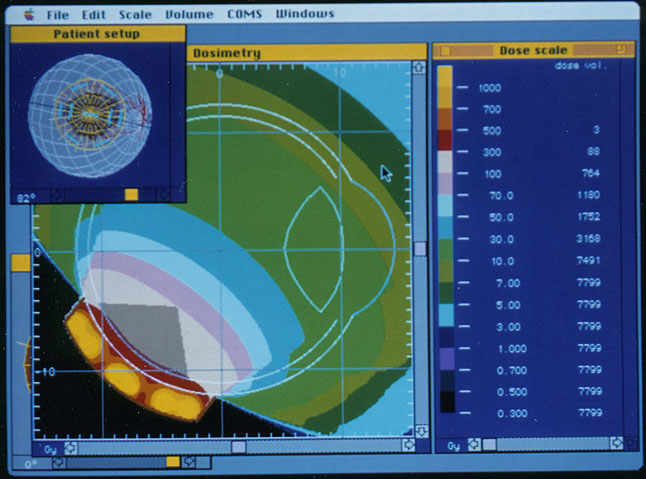
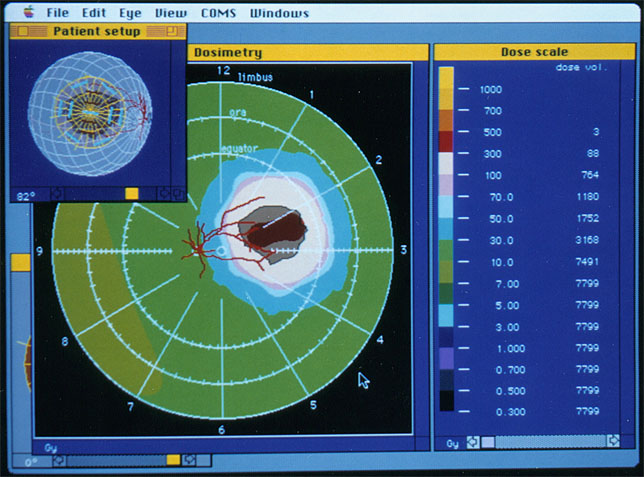
FIG. 2. Test case 2: These calculations are identical to those of the previous test case except that attenuation of the direct photon flux by the gold shell is now accounted for. The calculated dose distributions and dose volumes are plotted for (a) the transecting plane and (b) the retinal surface.
The dose distributions for the conditions of test case 1 were repeated, this time including the effect of shielding by the gold shell. The results are plotted in Fig. 2. Dose to the tumor volume and the margins within the plaque perimeter are unchanged from the previous case. The 300-Gy volume remained 88 mm³. However, the 100-Gy volume decreased to 764 mm³ and the T:M ratio changed to 2.1. These calculations suggest that not accounting for shielding, in this example, results in roughly a 30% overestimation of the macular dose, and 5% overestimation of the "treatment volume".
C. Test case 3
(a)
(b)
FIG. 3. Test case 3: The locations and orientations of the seeds from the previous cases (Figs. 1 and 2) were adjusted to improve the T:M ratio. The calculated dose distributions and dose volumes are plotted for (a) the transecting plane and (b) the retinal surface.
In the third optimization test case, the same nine seeds were installed in the plaque in a slightly different arrangement. The sources from the perimeter which were closest to the macula, but not shielded by the lip were moved to the center of the plaque. Then the carrier was rotated so that the central seeds were oriented with their inherent self-shielding directed towards the macula. The calculated dose distributions are plotted in Fig. 3. Note that margins and coverage of the tumor volume are essentially unchanged except for a narrowing of the margin in the region 6 mm from the macula at 1 o'clock on the retinal diagram. The 300-Gy volume increased somewhat to 100 mm³ while the 100-Gy volume dropped slightly to 716 mm³. The T:M ratio, however, improved to 3.1. These results suggest that a simple optimization strategy based on distance and source anisotropy might reduce the macular dose by about 30% compared to an arbitrary loading of the plaque, without compromising the tumor dose.
D. Test case 4
(a)
(b)
FIG. 4. Test case 4: For these calculations, four high-intensity seeds were substituted for the previous nine. Three 6.5 mCi sources were placed in the slots most distal to the macula, and one 9.0 mCi seed was placed in the slot closest to the macula, but shielded by the lip. the loading is illustrated in the "Patient setup" window. The calculated dose distributions and dose volumes are plotted for (a) the transecting plane and (b) the retinal surface.
The results of the last test case are presented in Fig. 4. In this case the plaque was loaded in order to emphasize the parameters of distance, activity distribution, and shielding. The nine previous sources were replaced by four higher intensity sources. The highest intensity source was specifically positioned in a location shielded from the macula by the lip of the plaque. Three lower intensity sources were installed in the portion of the plaque most distal to the macula. Coverage of the tumor volume and margins remained satisfactory. The 300-Gy volume was essentially identical to case 2 at 87 mm³ while the 100-Gy volume increased somewhat to 819 mm³. Most notably, the T:M ratio improved to 4.2. This is a twofold improvement of the T:M ratio compared to the second test case, without compromising the tumor dose.
Abstract |
Introduction & Methods |
Discussion & References