Dose distributions for a fully loaded COMS plaque and the prototype slotted plaque were calculated. The calculations are presented in Figs. 5 and 6, normalized to a dose of 1.0 at the apex of a 6 mm tall tumor. The modeled tumor has a circular base of 12 mm diameter, and is centered 57¡ (1 radian) circumferentially from the posterior pole towards the 3 o'clock position on the conventional retinal diagram. The model also assumes a scleral thickness of 1 mm, so the normalization point is, in fact, 7 mm from the plaque surface along the central axis of each plaque. For the COMS plaque, the gold shell provides excellent posterior and lateral shielding of the orbit, but due to the spherical shape of the eye, provides virtually no shielding to any uninvolved regions of the eye. The dose to the sclera beneath the tumor is three to four times greater than the dose to the tumor apex, even though the nearest surface of the sources is 1 mm from the scleral surface. For this particular tumor location, the dose to the macular region of the retina near the posterior pole of the eye is between 70% and 90% of the apical dose. With the slotted plaque, the model predicts scleral doses of less than twice the apex dose, even though the nearest surface of the sources is only 0.6 mm from the scleral surface. The macular dose is predicted to be less than 20% of the apex dose. Dose to the nearby ciliary region is also much less than with the conventional plaque.
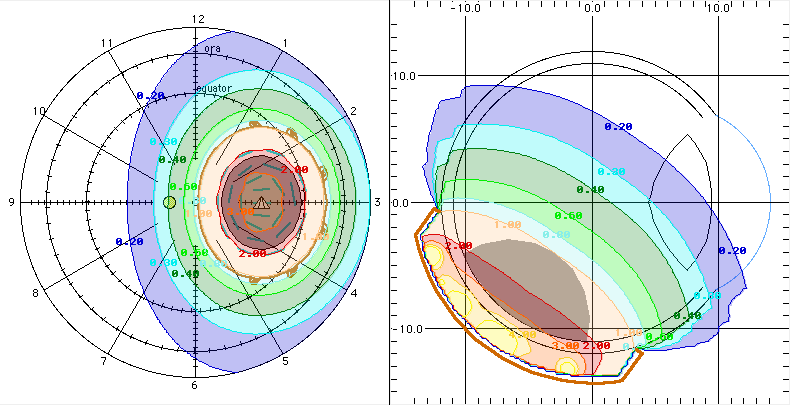
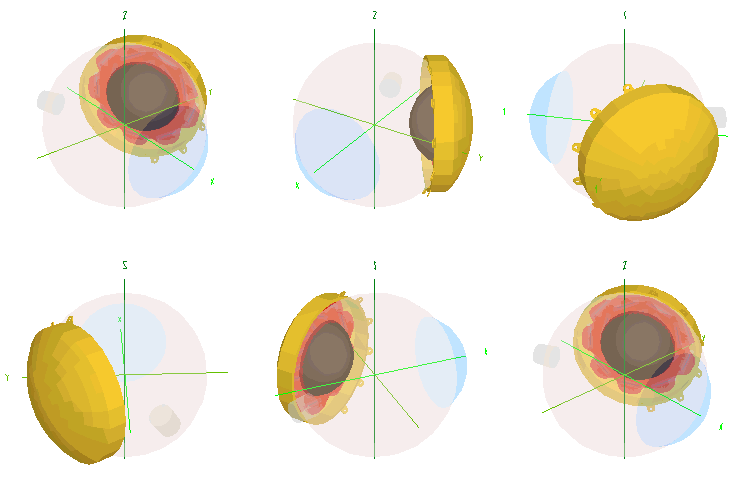
Fig. 5. Calculated dose distributions for a fully loaded standard 20 mm plaque. Dose has been normalized to a value of 1.0 at the apex of the tumor, 7 mm from the plaque surface. Normalized isodose contours of 5.0, 4.0, 3.0, 2.0, and 1.0 to 0.1 in intervals of 0.1 are shown. Note the high dose to the intervening sclera and macular region of the eye. The maximum dose to the sclera is approximately 4. (a) Three dimensional perspective view of the plaque, sources, and normalized 2.0 isodose surface (red). (b) Calculated isodose contours in the bisecting plane illustrated in (a) and color legend. (c) Calculated isodose contours on the retinal surface.
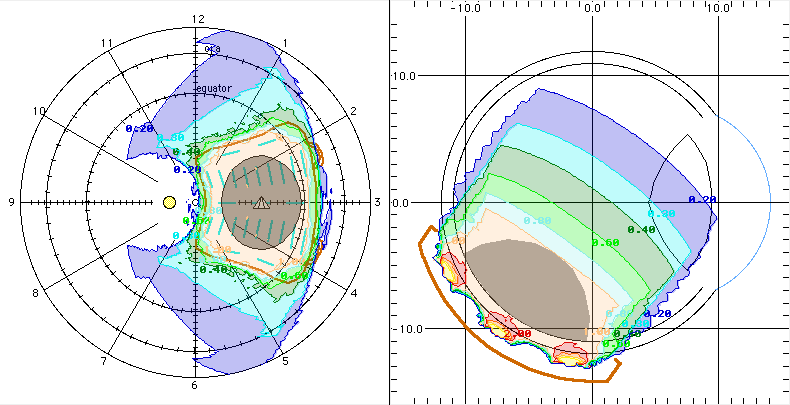
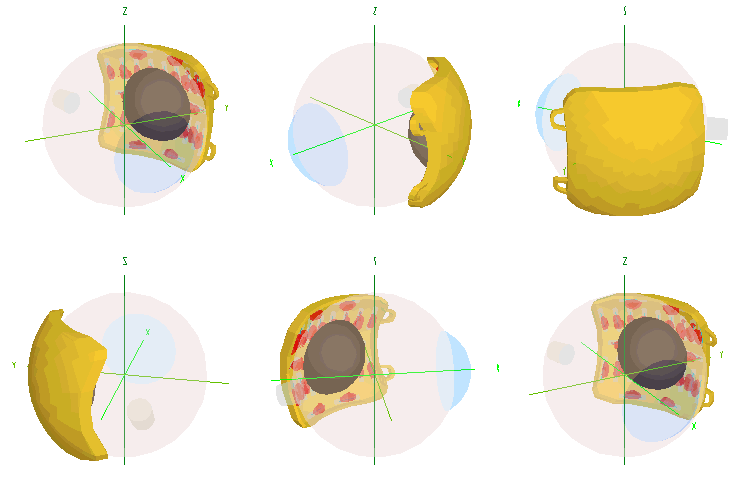
Fig. 6. Calculated dose distributions for a fully loaded 20 mm slotted plaque. Dose has been normalized to a value of 1.0 at the apex of the tumor, 7 mm from the plaque surface. Normalized isodose contours of 5.0, 4.0, 3.0, 2.0, and 1.0 to 0.1 in intervals of 0.1 are shown. Dose to the intervening sclera and macular region of the eye is significantly lower than for the standard plaque. The maximum dose to the sclera is approximately 2. (a) Three dimensional view of the plaque, sources, the bisecting two dimensional dosimetry plane and normalized 2.0 isodose surface (red). (b) Calculated isodose contours in the bisecting plane illustrated in (a) and color legend. (c) Calculated isodose contours on the retinal surface.
Dose volume histograms calculated for the modeled tumor (volume Å 0.24 cc) and the entire eye (volume Å 7.2 cc) are shown in Fig. 7. For the COMS plaque, some portions of the tumor receive nearly 3 times the apex dose. For the slotted plaque, the curve falls off more steeply, with the dose to no portion of the tumor approaching even twice the apex dose. Calculations for the entire eye indicate that no part of the eye receives more than 2.6 times the apical dose with the slotted plaque, compared to close to four times the apex dose for the COMS plaque. In this particular instance, the slotted plaque theoretically reduces the volume receiving 1.6 times the tumor apex dose by roughly a factor of 6 (.15 cc compared to .95 cc), although much of this volume is vitreous humor and not radiosensitive. Note that a small portion of the eye, corresponding to locations in the intervening sclera between the plaque and the base of the tumor, receives a dose greater than the maximum tumor dose. Both the dose and the volume of eye which receives a greater dose than the tumor are substantially reduced with the slotted plaque.
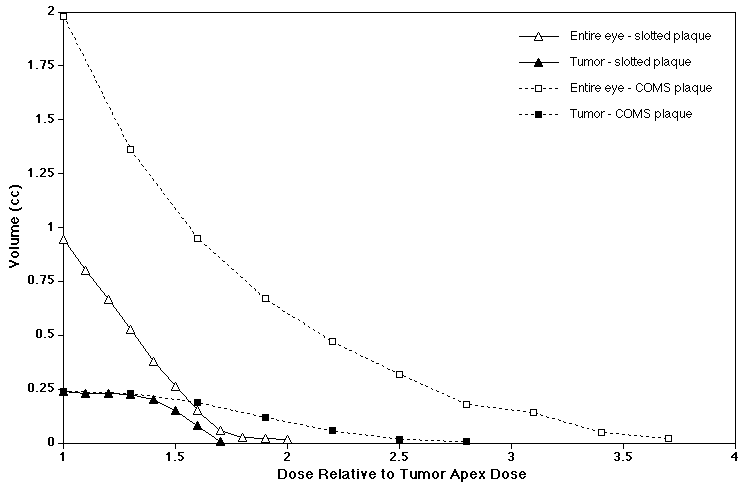
Fig. 7. Dose volume histograms for the entire eye and the modeled tumor volume for slotted and COMS 20 mm plaques. The volume of eye tissue which receives a dose greater than the maximum tumor dose is much less for the slotted plaque.
FilmPhotographic results of the radiochromic film study are shown in Fig. 8. As illustrated earlier in Fig. 4, films A and B are orthogonal exposures from five sources in a gold slotted plaque, and films C and D are from the same arrangement in a wax copy of the plaque. Films B and D were oriented along a plane corresponding to the mutual longitudinal axes of the sources. It is apparent from the photographs that the sources were not perfectly centered on the apex of the phantom when films C and D were exposed, so there is a small rotation of the exposure pattern. This rotation is inconsequential to film D due to the hemispherical geometry. The exposures demonstrate that longitudinal anisotropy is maintained in the side by side source alignment.
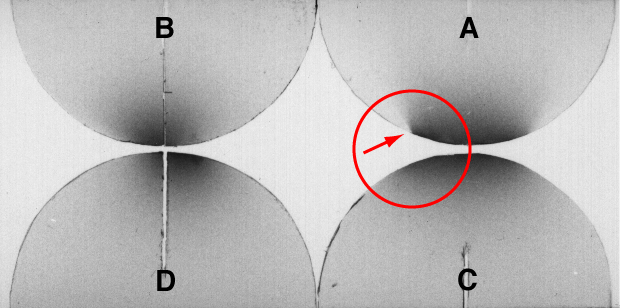
Fig. 8. Radiochromic film study of five "side by side" sources in the slotted plaque. Films A &B are orthogonal planes (see Fig. 4) for a slotted plaque made of gold. C and D are for the same geometry in a slotted plaque made of wax. The effectiveness of the gold slots is demonstrated by the sharper edge on the left, and the thinner "shell-like" darkening of film A when compared to C. Anisotropy resulting from internal absorption is visible in both B and D.
Films A and C were positioned in planes nearly perpendicular to the longitudinal axes of the sources. Note that the region of greatest darkening appears more like a thin shell along the rim of film A compared to film C which has a more "dome-like" appearance. The lateral shielding of the gold slots is evident on the left side of film A, which shows a far more distinct collimating edge to the exposure than does film C. The right "edge" of the exposure in film A is not as distinct as the left edge. This can be attributed to wobble between the plaque and phantom (the plaque has a slightly larger spherical radius than the phantom) resulting in a small displacement of the right side of the plaque away from the surface of the phantom. The lateral shielding of the slots was designed to be effective principally at distances of a millimeter or less in front of the plaque surface, corresponding to the sclera of the eye. In the clinical situation, the sclera of the eye, being softer than the acrylic phantom, would be expected to better conform to the concave surface of the plaque due to pressure from the sutures and surrounding tissues.
TLDShown in figures 9 and 10 are plots of calculated and measured dose rates at various depths from the surface of the phantom on the axis of symmetry of five I-125 sources in radial or parallel arrangements loaded in otherwise identical plaques cast of wax or gold. The intersection of the measurement axis with the plaque is indicated by an arrow in each figure. The calculated dose rate, normalized to a value of 1.0 at 7 mm depth (as in Figs. 5 and 6), is plotted in the lower panels of Figs. 9 and 10.
The ratios of measured to calculated (absolute) dose rate to a water dose calibrated TLD in acrylic, and the standard deviation of each of these measured ratios are plotted in the upper panels of Figs. 9 and 10.
In Fig. 9 the sources are in a radial arrangement. This results in minimal slot shielding in the direction of the measurement axis (in this case, the central axis of the plaque) for a gold plaque, and, of course, complete lack of shielding in a wax plaque.We found good agreement between the calculated and measured dose rates.
In Fig. 10 the sources are in a tight side by side pattern. This results in maximum mutual shielding in the direction of the measurement axis when the plaque is made of gold. In a wax plaque, the sources are held in the same geometric arrangement, but there is no slot shielding.
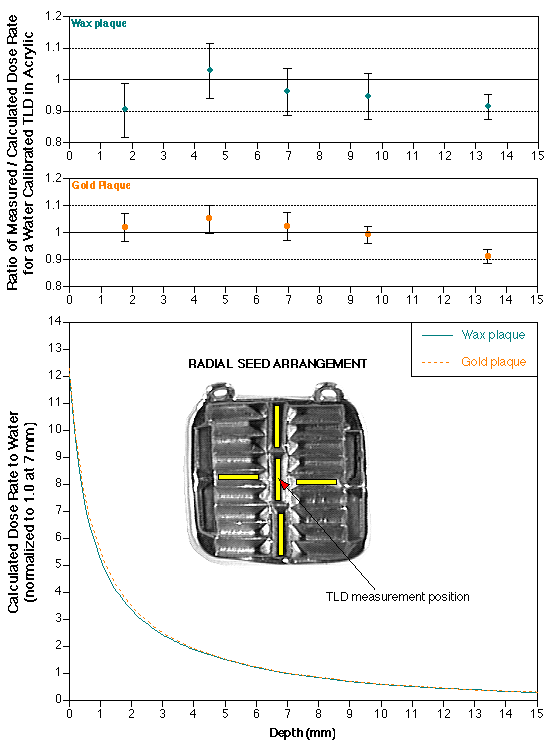
Fig. 9. Calculated and measured dose rates on the axis of symmetry of five sources in a radial arrangement. Calculated dose has been normalized to 1.0 at 7 mm depth. See text for further explanation.
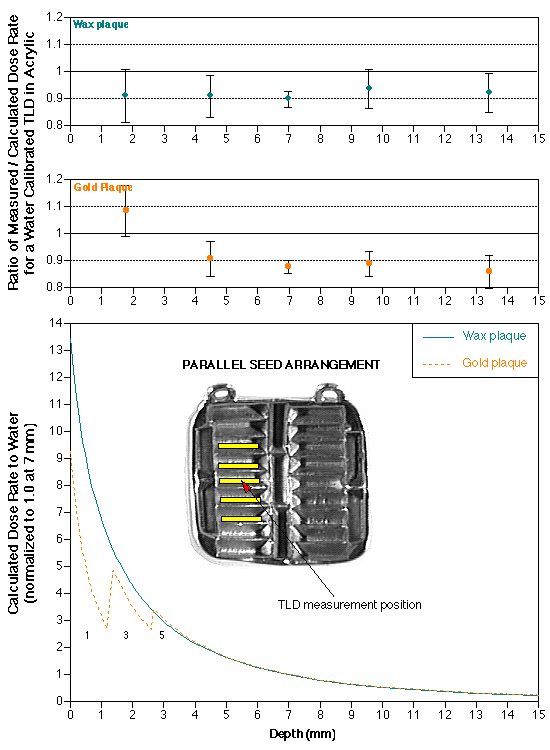
Fig. 10. Calculated and measured dose rates on the axis of symmetry of five sources in a parallel "side by side" arrangement. The calculation for the gold plaque (dashed line) illustrates the regions which fall within the "fields of view" of 1, 3 and 5 sources.
The calculation for the gold plaque (dashed line) in Fig. 10 suggests that the region between 0 and 3 mm depth is one of steep dose rate gradients where the "fields of view" of the five sources overlap. Our simplified "field of view" model predicts that out to about 1 mm, only the source directly beneath the measurement position contributes to the calculated dose rate. Beyond 1 mm the two laterally adjacent sources become "visible" and contribute to the calculated dose rate. By 3 mm, all five sources are contributing to the calculated dose rate. Although we were only able to make measurements at one depth in this interesting region, the agreement with calculation is reasonable considering the 1 mm physical diameter of the TLD. As mentioned earlier, we did expect the calculation to underestimate dose rate immediately adjacent to the slotted surface.
The difference in calculated dose rate in the region which corresponds to the sclera (depth Å0.5 mm) in Figs. 9 and 10 again illustrates the advantages of the slotted plaque. In the worst case, 5 sources side by side in a slotless plaque (represented by the wax plaque), result in a dose rate at 0.5 mm which is about 10 times the dose rate at 7 mm. The radial source arrangement, in which four of the five sources direct their inherent longitudinal shielding towards the central axis is a bit better at about 8 times the dose at 7 mm. When the five sources are arranged side by side in gold slots, the ratio drops to about 5 times the dose at 7 mm.
Figure 11 compares calculated isodose contours with TLD measurements in the plane of symmetry which bisects an arrangement of nine sources side by side in both slotted and unslotted (wax) plaques. The cross-sectional area of each 1 mm rod TLD is represented by the box in which the dose is displayed. Dose rate was calculated and measured for both gold and wax plaques. The indicated values are the mean of several repetitions and of left-right mirroring with respect to the line of symmetry on the central axis of the diagram. The calculations are normalized to a point 4.48 mm from the plaque surface, corresponding to the center of the middle TLD of the second row, and representing the apical dose of a roughly 4 mm tall tumor. The TLD measurements have also been normalized to that same TLD.
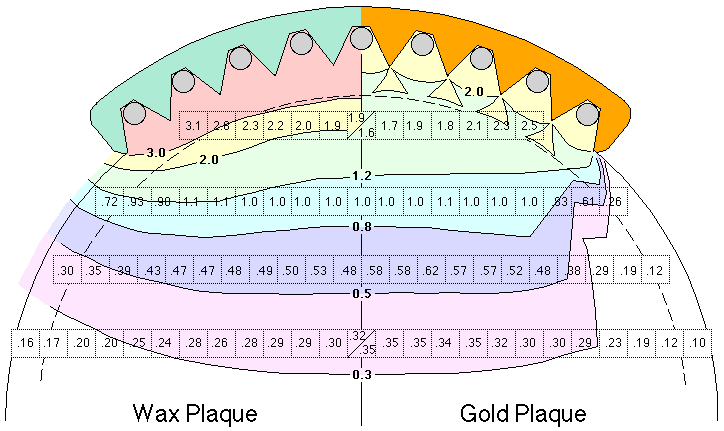
Fig. 11. Normalized composite of "planar" dose measurements for nine sources in "side by side" geometry. The left and right sides of the figure compare 1 mm rod thermoluminescent dosimetry measurements with calculated isodose contours in nearly identical slotted plaques made of wax or gold. The sharp collimating edge and improved homogeneity resulting from the gold slots is evident. The measured doses and calculated isodoses show close agreement.
Shielding of the retina and sclera adjacent to the physical edge of the gold slotted plaque is demonstrated by comparing the most peripheral TLDs of each row. The gold vs. wax plaque normalized dose rates of .12 vs. .30 (Row 3) and .26 vs. .72 (Row 2) show, quantitatively, shielding of regions adjacent to a gold slotted plaque, as predicted by the model and shown qualitatively in the chromic film study. The measured dose rates, in general, match the calculated isodose contours.