The Retinal Diagram Window
The Retinal Diagram window is where the shape of the tumor base and other anatomic landmarks of interest are digitized. Photographs of the inner surface of the eye can be displayed in this window to assist the digitization. This window is also where the height and shape of the tumor is entered, muscle insertions are estimated, the plaque is positioned and suture coordinates on the scleral surface are calculated. In fact, most of the work and decisions involved in eye plaque treatment planning will be performed in this window using this map of the inner surface of the eye.
A retinal diagram is a 2D polar map of the retinal surface, in cartography it is referred to as an azimuthal equidistant projection. All points on such a map are at proportionately correct distances from the center point, and are also at the correct azimuth from the center point. The flag of the United Nations contains an example of a polar azimuthal equidistant projection with the north pole at its center.

The standard Posterior retinal map is centered at the posterior pole of the eye. The radial spokes are meridian lines which extend to the inner limbus. The circles, in expanding order, represent the equator, ora serrata, and the inner limbus. The ciliary body is approximated as occupying the space between the ora and the inner limbus. In Plaque Simulator, the standard retinal diagram is modeled as being an oblate spheroidal surface 1 mm inset from the outer surface of the sclera. By default, the tick marks on the diagram are spaced at 1 mm of arc increments. You may optionally display tick marks using degree spacing. 5 degrees is approximately 1 mm of arc on the inner sclera near the equator of a 25 mm diameter eye.
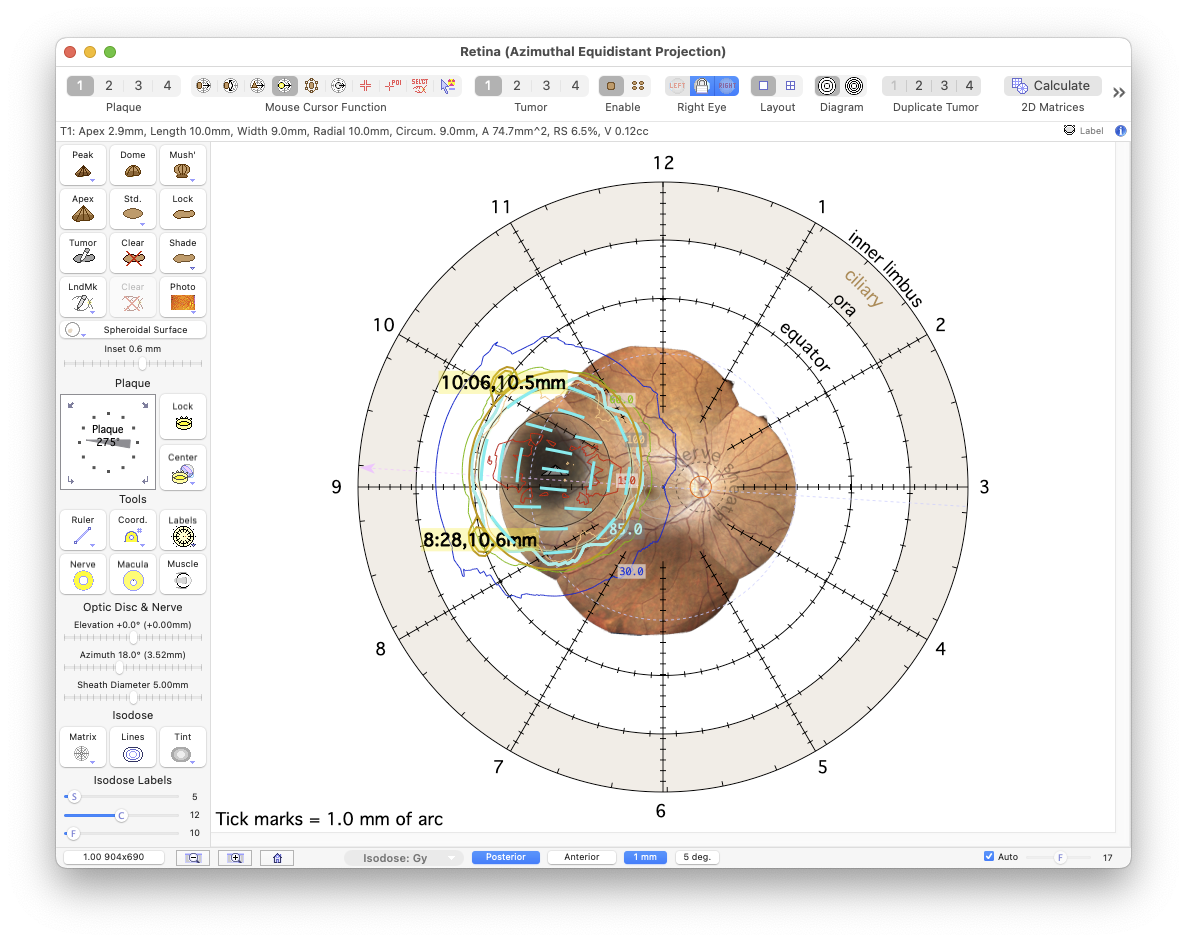
Standard Posterior Centric Projection with Clock Hour Meridians
Retinal diagram with a calibrated and circumferentially warped fundus collage.
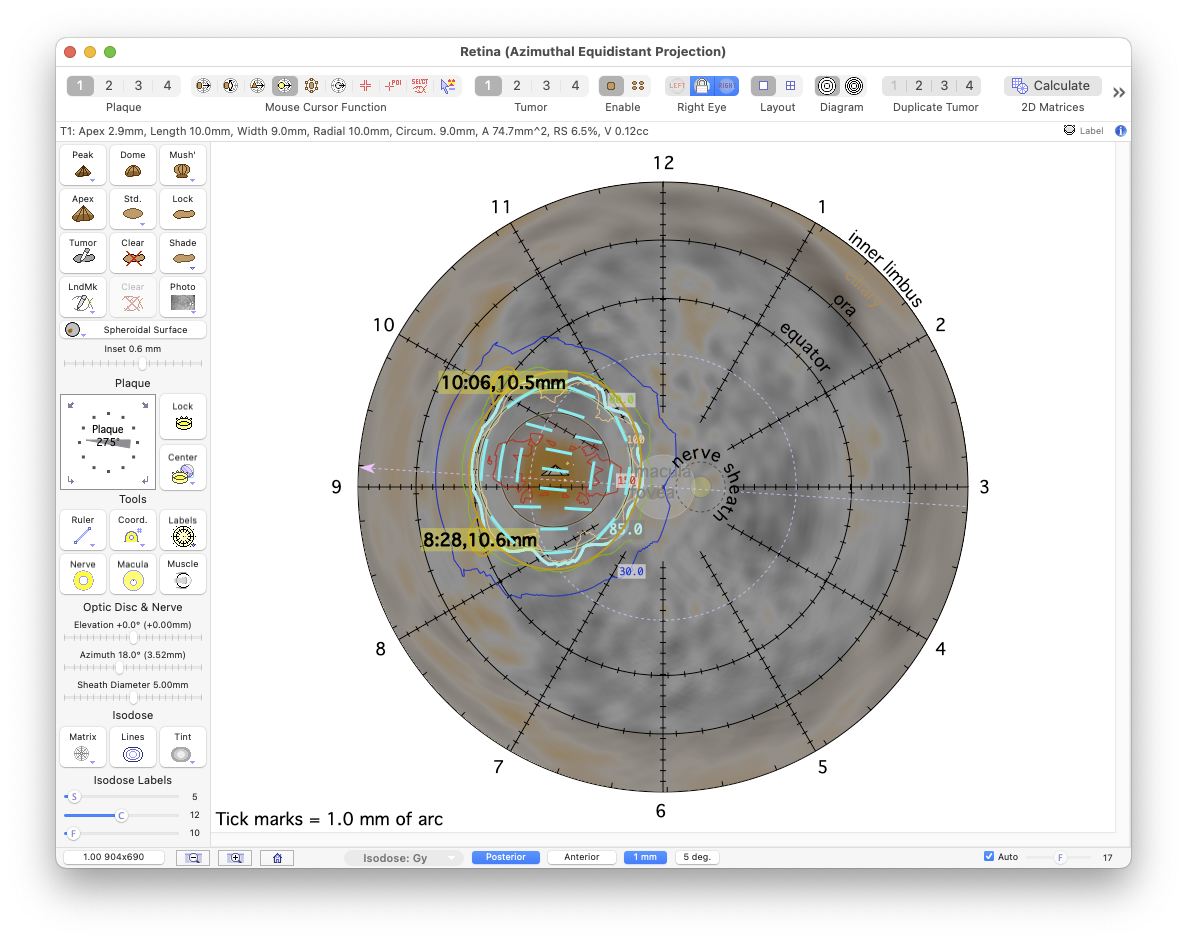
Retinal diagram with spheroidal surface reconstruction.
Pixels with monochrome shades matching those of the tumor base have been pseudo-colored with a brown tint.
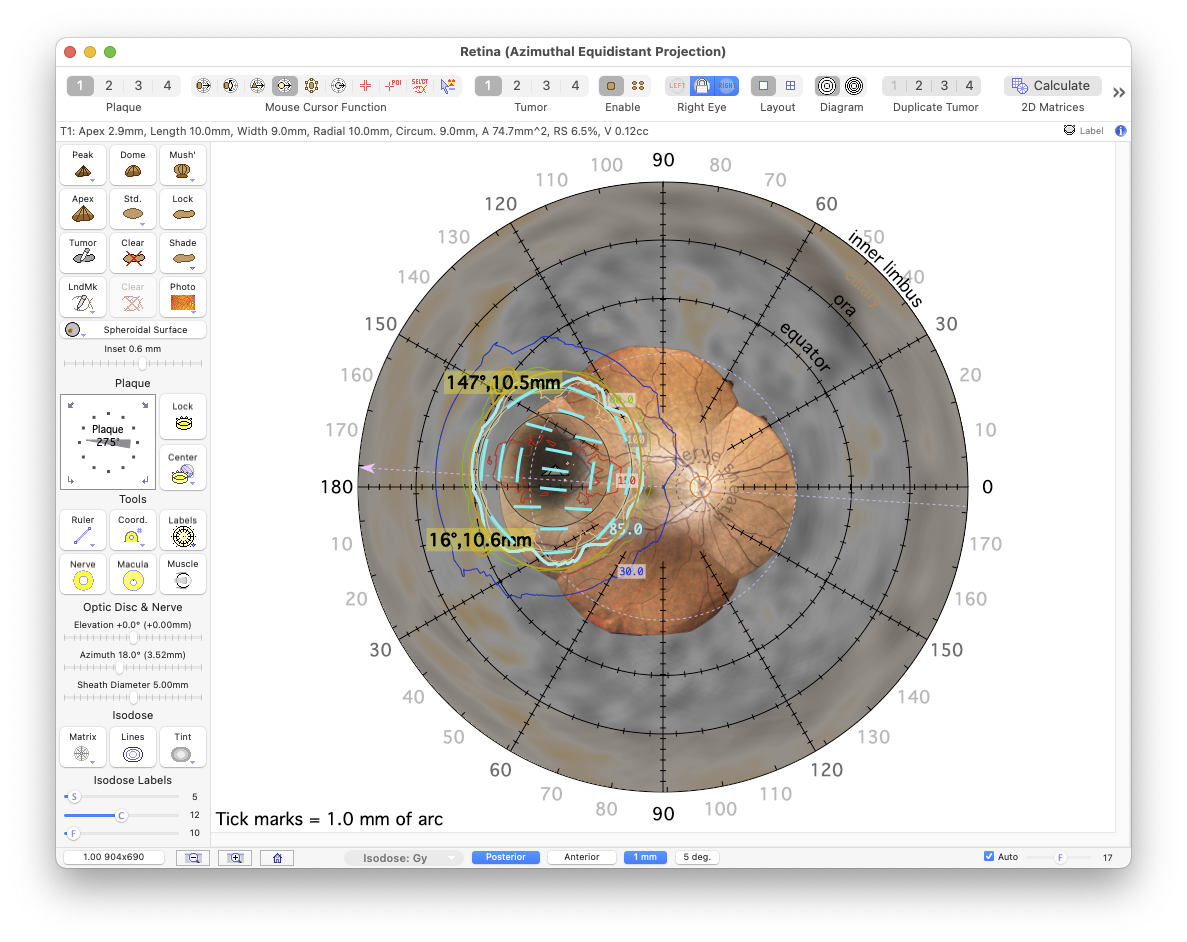
Plaque Simulator suture coordinates are a 2D coordinate system on the outer surface of the sclera. A suture coordinate consists of a meridian plane (analogous to earth longitude), expressed as either a clock hour or a toric axis marker angle, and a chord distance along that meridian, measured from the limbus circle using a Castroviejo caliper. For example, using the default clock hour method, the coordinates of the sutures are at (10:06,10.5 mm) and (8:28,10.6 mm). Using the optional axis marker method, those same coordinates would be expressed as the azimuthal angle and caliper distance pair (147°,10.5 mm) and (16°,10.6 mm). The Retinal Diagram Document preferences can be set to print both a clock hour and an angular version of the diagram (on separate pages) for reference during surgery.
Standard Posterior Centric Projection with Angular Meridians
Retinal diagram with a calibrated and circumferentially warped fundus collage.
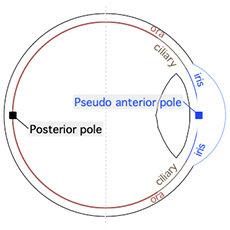
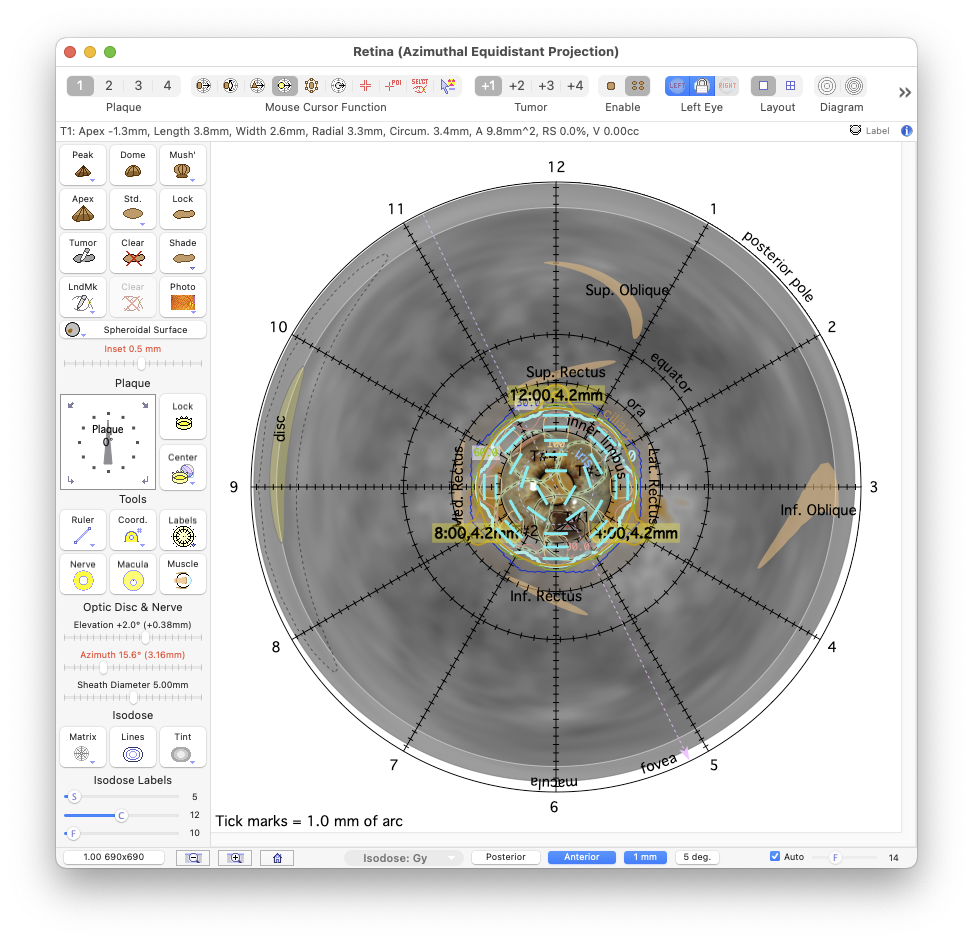
The alternative Anterior map is centered on the pole of the oblate anterior inner surface of the eye. As in the posterior projection, the inner oblate surface is modeled as being 1 mm inset from the outer surface of the sclera from the posterior pole to the limbus and the curvature is then extrapolated from the inner limbus to the pseudo anterior pole which approximates the center of the pupil opening in the iris.
The radial spokes are meridian lines which extend from the inner limbus to the posterior pole. The circles, in expanding order, represent the inner limbus, ora serrata, equator, macula, fovea and finally the posterior pole, a point in 3D space which distorts to form the outermost circle of this 2D map. The tick marks on the diagram default to a spacing of 1 mm of arc but may optionally be displayed using degree spacing.
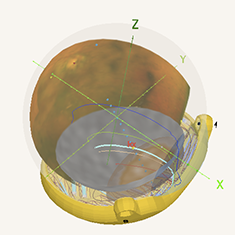
The anterior projection should be used when working with iris and ciliary tumors. A limitation of the anterior projection is that you can not overlay a fundus collage or an scanning laser ophthalmoscopy (SLO) picture. You may, however, calculate a spheroidal surface reconstruction from 3D CT and overlay a picture of the iris. This example illustrates treatment of the entire iris. The target region is modeled as a composite of 4 small tumors.
Anterior Centric Projection with Clock Hour Meridians
Retinal diagram with spheroidal surface reconstruction.
Pixels with monochrome shades matching those of the tumor base have been pseudo-colored with a brown tint.
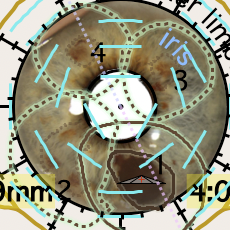
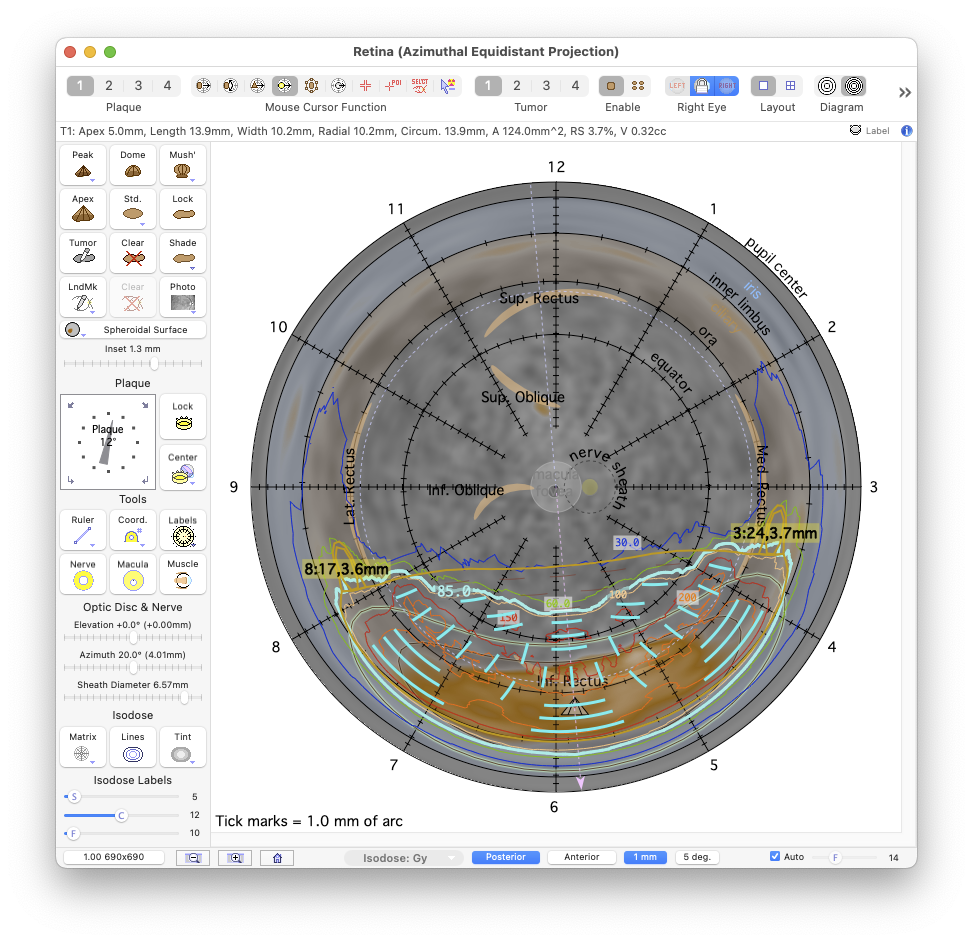
The circles of the extended posterior centric projection, in expanding order, represent the equator, ora serrata, the inner limbus, the pupil opening in the iris and the pseudo anterior pole. The pseudo anterior pole is, of course, actually a point in 3D space which distorts to form the outermost circle of this 2D map (this is analogous to the way the northern and southern poles of the earth distort to form the northern and southern rectangular edges of the commonly encountered Mercator cylindrical projection map of the earth). The iris is approximated as occupying the space between the inner limbus and the pupil opening in the iris. The pseudo anterior pole lies at the center of the pupil (aka iris center).
This extended projection is best used when working with ciliary region tumors that extend to the inner limbus.
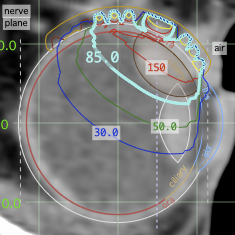
Ciliary tumors are too anterior to optically photograph. You can use multiplanar and spheroidal surface reconstructions from 3D CT to model and map these tumors as illustrated here (e.g. a spheroidal surface reconstruction of the tumor base in this example has been mapped to the retinal diagram and pseudo-colored with a brown tint) and plot isodose coverage of the tumor base-margin (PTV) anterior to the inner limbus. Alternatively, you can use the anterior projection for these cases.
Extended Posterior Centric Projection with Clock Hour Meridians
The Diagram control in the toobar selects between standard and extended posterior maps. The extended posterior retinal map is also centered at the posterior pole of the eye. The radial spokes are meridian lines which extend to the pseudo anterior pole located at the center of the pupil opening in the iris (rather than to the inner limbus as for the standard posterior map).
Retinal diagram with spheroidal surface reconstruction.
Pixels with monochrome shades matching those of the tumor base have been pseudo-colored with a brown tint.
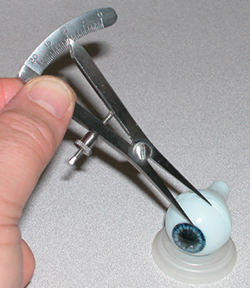
Castroviejo caliper
To use the calculated suture eyelet coordinates, clock hour (or angle) meridian and distance, the surgeon first marks the calculated meridian lines on the sclera, either by visually estimating from experience, or using a toric (azimuthal) axis marker. Then, using a Castroviejo caliper, the suture points are marked at the calculated chord distances from the limbus along the clock hour (or anglular) meridian lines.

Toric axis marker